« Back to Lake Michigan Beach Rivers
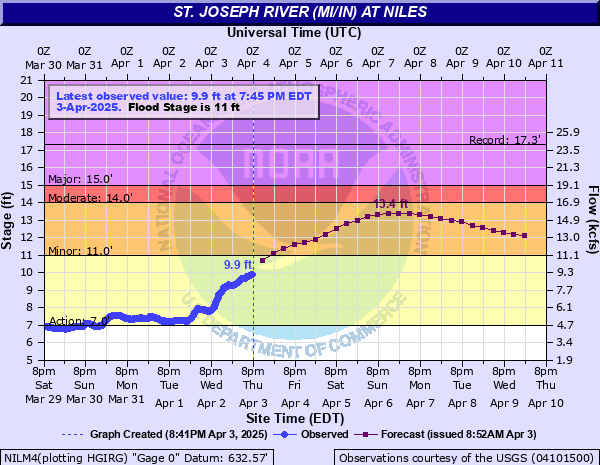
St. Joseph River (MI/IN) at Niles
Critical Stages
7' - Action
11' - Flood
14' - Moderate
15' - Major
Latest Observation
Updated: 6:45 AM EST 12/6/25
Status: No Flooding
Stage: 4.88 ft
Flow: 2.14 kcfs
Forecast
Forecast not available for this location.
| Time | Stage (ft) | Flow (kcfs) |
|---|---|---|
| 6:45 AM 12/6 | 4.88 | 2.14 |
| 6:30 AM 12/6 | 4.88 | 2.14 |
| 6:15 AM 12/6 | 4.87 | 2.12 |
| 6:00 AM 12/6 | 4.86 | 2.11 |
| 5:45 AM 12/6 | 4.85 | 2.1 |
| 5:30 AM 12/6 | 4.84 | 2.08 |
| 5:15 AM 12/6 | 4.83 | 2.07 |
| 5:00 AM 12/6 | 4.82 | 2.05 |
| 4:45 AM 12/6 | 4.81 | 2.04 |
| 4:30 AM 12/6 | 4.8 | 2.03 |
| 4:15 AM 12/6 | 4.79 | 2.01 |
| 4:00 AM 12/6 | 4.78 | 2 |
| 3:45 AM 12/6 | 4.77 | 1.99 |
| 3:30 AM 12/6 | 4.76 | 1.97 |
| 3:15 AM 12/6 | 4.75 | 1.96 |
| 3:00 AM 12/6 | 4.74 | 1.94 |
| 2:45 AM 12/6 | 4.73 | 1.93 |
| 2:30 AM 12/6 | 4.73 | 1.93 |
| 2:15 AM 12/6 | 4.72 | 1.92 |
| 2:00 AM 12/6 | 4.72 | 1.92 |
| 1:45 AM 12/6 | 4.72 | 1.92 |
| 1:30 AM 12/6 | 4.71 | 1.91 |
| 1:15 AM 12/6 | 4.71 | 1.91 |
| 1:00 AM 12/6 | 4.71 | 1.91 |
| 12:45 AM 12/6 | 4.71 | 1.91 |
| 12:30 AM 12/6 | 4.71 | 1.91 |
| 12:15 AM 12/6 | 4.71 | 1.91 |
| 12:00 AM 12/6 | 4.71 | 1.91 |
| 11:45 PM 12/5 | 4.71 | 1.91 |
| 11:30 PM 12/5 | 4.71 | 1.91 |
15' -
Major flooding can be expected in Niles. High water will affect Water, Marmont, River, and 2nd Streets in Niles. High water will also affect residents living on the first floor of buildings along River Street.
14' -
Moderate flooding occurs in Niles. High water will affect Water Street, and low sections of Marmont and River Streets in Niles. Lowland flooding surrounding Island Park and low lying areas along the river near the wastewater treatment plant can be expected.
12.5' -
Minor flooding of low lying areas adjacent to the river as well as flooding of basements in Niles can be expected.
11' -
Minor flooding of low lying areas adjacent to the river, Island Park, and basement flooding of residences along River and Mairmont Streets in Niles can be expected.
10' -
High water affects Island Park in Niles.
9' -
Minor overflow can be expected into low lying areas adjacent to the river.
| Date | Stage (ft) |
|---|---|
| Feb 22, 2018 | 17.33 |
| Apr 5, 1950 | 15.1 |
| Mar 21, 1982 | 14.97 |
| Feb 25, 1985 | 14.96 |
| Jan 9, 2008 | 14.19 |
| Mar 11, 2009 | 13.82 |
| May 26, 1943 | 13.78 |
| Jan 5, 1993 | 13.77 |
| Jun 10, 1993 | 13.6 |
| Dec 31, 1990 | 13.58 |
| Feb 7, 2008 | 13.4 |
| Jun 10, 1996 | 13.4 |
| Jun 4, 1989 | 13.3 |
| Jan 14, 2005 | 12.76 |
| Mar 6, 1976 | 12.53 |
| Jun 15, 1981 | 12.5 |
| May 13, 1956 | 12.45 |
| Apr 20, 2013 | 12.4 |
| Mar 6, 1979 | 12.36 |
| Sep 15, 2008 | 12.22 |
Data provided by the National Weather Service.