« Back to Lake Michigan Beach Rivers
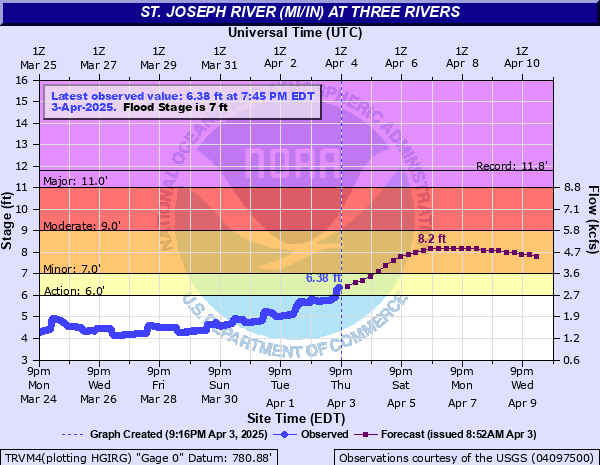
St. Joseph River (MI/IN) at Three Rivers
Critical Stages
6' - Action
7' - Flood
9' - Moderate
11' - Major
Latest Observation
Updated: 6:45 AM EST 12/6/25
Status: No Flooding
Stage: 3 ft
Flow: 0.605 kcfs
Forecast
Forecast not available for this location.
| Time | Stage (ft) | Flow (kcfs) |
|---|---|---|
| 6:45 AM 12/6 | 3 | 0.605 |
| 6:30 AM 12/6 | 3 | 0.605 |
| 6:15 AM 12/6 | 3 | 0.605 |
| 6:00 AM 12/6 | 3 | 0.605 |
| 5:45 AM 12/6 | 3 | 0.605 |
| 5:30 AM 12/6 | 3 | 0.605 |
| 5:15 AM 12/6 | 3 | 0.605 |
| 5:00 AM 12/6 | 3 | 0.605 |
| 4:45 AM 12/6 | 3 | 0.605 |
| 4:30 AM 12/6 | 3 | 0.605 |
| 4:15 AM 12/6 | 3 | 0.605 |
| 4:00 AM 12/6 | 3 | 0.605 |
| 3:45 AM 12/6 | 3 | 0.605 |
| 3:30 AM 12/6 | 3 | 0.605 |
| 3:15 AM 12/6 | 3 | 0.605 |
| 3:00 AM 12/6 | 3 | 0.605 |
| 2:45 AM 12/6 | 3 | 0.605 |
| 2:30 AM 12/6 | 3 | 0.605 |
| 2:15 AM 12/6 | 3 | 0.605 |
| 2:00 AM 12/6 | 3 | 0.605 |
| 1:45 AM 12/6 | 3 | 0.605 |
| 1:30 AM 12/6 | 3 | 0.605 |
| 1:15 AM 12/6 | 3 | 0.605 |
| 1:00 AM 12/6 | 3 | 0.605 |
| 12:45 AM 12/6 | 3 | 0.605 |
| 12:30 AM 12/6 | 3 | 0.605 |
| 12:15 AM 12/6 | 3 | 0.605 |
| 12:00 AM 12/6 | 3 | 0.605 |
| 11:45 PM 12/5 | 3 | 0.605 |
| 11:30 PM 12/5 | 3 | 0.605 |
11.8' -
Major flooding of Scidmore Park and residences in Three Rivers can be expected.
10.6' -
Expect moderate flooding of Scidmore Park. Flooding of the basements of several homes and businesses along south Main Street in the vicinity of the lumber yard can be expected.
9' -
Moderate flooding of Scidmore Park can be expected. Evacuation of some animals in the park zoo can also be expected. High water affects several businesses and floods the basements of homes along south Main, Green, and Jackson Streets.
8' -
Minor flooding of apartments near the river along Mechanic Street, the River Glen Condos on east Michigan Ave, and basements of several homes along River Drive can be expected.
7' -
Expect minor flooding of the Scidmore Park picnic facilities in Three Rivers.
| Date | Stage (ft) |
|---|---|
| Jun 3, 1989 | 11.8 |
| Feb 24, 2018 | 11.37 |
| Mar 21, 1982 | 10.69 |
| Apr 27, 1950 | 10.6 |
| Feb 27, 1985 | 10.52 |
| May 20, 2020 | 9.76 |
| Apr 10, 1985 | 9.75 |
| Mar 12, 2009 | 9.55 |
| Jan 1, 1993 | 9.52 |
| Jan 12, 2008 | 9.44 |
| Sep 17, 2008 | 9.29 |
| Mar 7, 1976 | 9.08 |
| Mar 11, 1974 | 8.91 |
| Jun 7, 1980 | 8.87 |
| Jan 6, 1993 | 8.51 |
| Apr 15, 1983 | 8.5 |
| Jan 8, 1993 | 8.42 |
| Feb 5, 1968 | 8.4 |
| Apr 22, 2013 | 8.34 |
| Feb 13, 2001 | 8.31 |
Data provided by the National Weather Service.