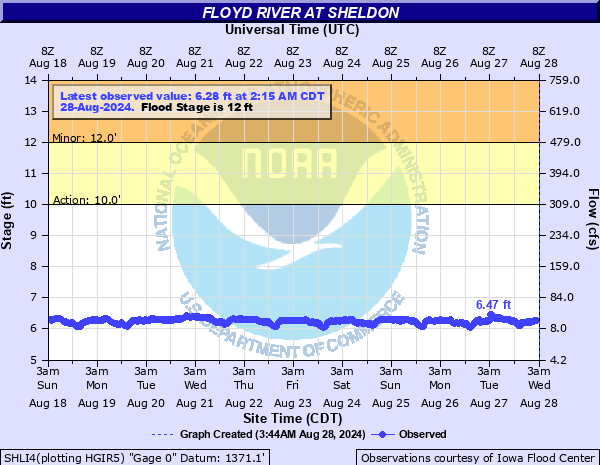
Floyd River at Sheldon
Critical Stages
10' - Action
12' - Flood
14' - Moderate
16' - Major
Latest Observation
Updated: 2:00 AM CST 12/16/25
Status: No Flooding
Stage: 5.67 ft
Flow: 0.003 kcfs
Forecast
Forecast not available for this location.
| Time | Stage (ft) | Flow (kcfs) |
|---|---|---|
| 2:00 AM 12/16 | 5.67 | 0.003 |
| 1:00 AM 12/16 | 5.67 | 0.003 |
| 12:00 AM 12/16 | 5.61 | 0.003 |
| 11:00 PM 12/15 | 5.62 | 0.003 |
| 9:00 PM 12/15 | 5.55 | 0.003 |
| 8:00 PM 12/15 | 5.52 | 0.003 |
| 7:00 PM 12/15 | 5.55 | 0.003 |
| 6:00 PM 12/15 | 5.51 | 0.003 |
| 5:00 PM 12/15 | 5.42 | 0.0022 |
| 4:00 PM 12/15 | 5.39 | 0.002 |
| 3:00 PM 12/15 | 5.26 | 0.002 |
| 2:00 PM 12/15 | 5.24 | 0.002 |
| 1:00 PM 12/15 | 5.31 | 0.002 |
| 12:00 PM 12/15 | 5.34 | 0.002 |
| 11:00 AM 12/15 | 5.4 | 0.002 |
| 10:00 AM 12/15 | 5.47 | 0.0027 |
| 9:00 AM 12/15 | 5.6 | 0.003 |
| 8:00 AM 12/15 | 5.62 | 0.003 |
| 7:00 AM 12/15 | 5.62 | 0.003 |
| 6:00 AM 12/15 | 5.66 | 0.003 |
| 5:00 AM 12/15 | 5.65 | 0.003 |
| 4:00 AM 12/15 | 5.63 | 0.003 |
| 3:00 AM 12/15 | 5.63 | 0.003 |
| 2:00 AM 12/15 | 5.63 | 0.003 |
| 1:00 AM 12/15 | 5.64 | 0.003 |
| 12:00 AM 12/15 | 5.61 | 0.003 |
| 11:00 PM 12/14 | 5.64 | 0.003 |
| 9:00 PM 12/14 | 5.65 | 0.003 |
| 8:00 PM 12/14 | 5.67 | 0.003 |
| 7:00 PM 12/14 | 5.63 | 0.003 |
21.5' -
The bridge on 300th Ave is overtopped. Water nears the feedhorn of the automated sensor and thus data may be lost.
20.5' -
N 2nd Ave and additional nearby structures may flood.
19.5' -
The south approach to the bridge on Highway 60 begins to flood. Houses in the Hills Park area may be surrounded by water.
18' -
The railroad tracks are flooded and water begins to approach the parking lots of some structures off of N 2nd Ave. The bridge on Monroe Ave may be overtopped.
16.5' -
Water approaches the railroad tracks off of N 2nd Ave and the bottom of the bridge on Monroe Ave. The highest banks and levees are overtopped and major agricultural flooding begins.
16' -
The lowest portions of Monroe Ave begin to flood.
14' -
Flooding affects large areas of farm land within 1000 feet of the river.
13' -
Olive Ave may be closed due to flooding.
12' -
Agricultural flooding begins.
11' -
The lower banks begin to overflow. Portions of the Sheldon tree dump are under 1 to 2 feet of water.
| Date | Stage (ft) |
|---|---|
| Jun 7, 1953 | 19.96 |
| Jun 22, 2024 | 17.62 |
| Jun 21, 2018 | 15.5 |
| Jul 22, 2010 | 14.1 |
| Mar 14, 2019 | 13.7 |
| Mar 28, 1962 | 13 |
| Jun 18, 2014 | 12.65 |
| Mar 12, 2007 | 12.5 |
| Jun 12, 1984 | 12.5 |
| Jun 23, 1994 | 12.25 |
| Jun 20, 1983 | 12.2 |
| Mar 11, 1997 | 11.8 |
| Mar 27, 1993 | 11.72 |
| Mar 18, 1986 | 11.15 |
| Jun 22, 1984 | 10.9 |
| Mar 2, 1982 | 10.8 |
| Apr 13, 1983 | 10.7 |
| Apr 23, 1985 | 10.65 |
| Jun 30, 1983 | 10.6 |
| Mar 25, 1984 | 10.6 |
Data provided by the National Weather Service.