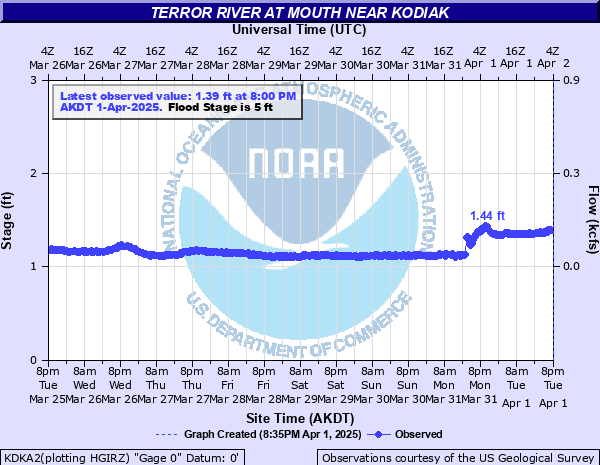
Terror River at Mouth near Kodiak
Critical Stages
4' - Action
5' - Flood
7' - Moderate
Major
Latest Observation
Updated: 5:00 AM AKST 12/16/25
Status: No Flooding
Stage: 0.94 ft
Flow: 0.0621 kcfs
Forecast
Forecast not available for this location.
| Time | Stage (ft) | Flow (kcfs) |
|---|---|---|
| 5:00 AM 12/16 | 0.94 | 0.0621 |
| 4:45 AM 12/16 | 0.93 | 0.0606 |
| 4:30 AM 12/16 | 0.94 | 0.0621 |
| 4:15 AM 12/16 | 0.94 | 0.0621 |
| 4:00 AM 12/16 | 0.94 | 0.0621 |
| 3:45 AM 12/16 | 0.94 | 0.0621 |
| 3:30 AM 12/16 | 0.94 | 0.0621 |
| 3:15 AM 12/16 | 0.93 | 0.0606 |
| 3:00 AM 12/16 | 0.94 | 0.0621 |
| 2:45 AM 12/16 | 0.94 | 0.0621 |
| 2:30 AM 12/16 | 0.94 | 0.0621 |
| 2:15 AM 12/16 | 0.94 | 0.0621 |
| 2:00 AM 12/16 | 0.94 | 0.0621 |
| 1:45 AM 12/16 | 0.94 | 0.0621 |
| 1:30 AM 12/16 | 0.95 | 0.0637 |
| 1:15 AM 12/16 | 0.95 | 0.0637 |
| 1:00 AM 12/16 | 0.94 | 0.0621 |
| 12:45 AM 12/16 | 0.95 | 0.0637 |
| 12:30 AM 12/16 | 0.95 | 0.0637 |
| 12:15 AM 12/16 | 0.95 | 0.0637 |
| 12:00 AM 12/16 | 0.95 | 0.0637 |
| 11:45 PM 12/15 | 0.95 | 0.0637 |
| 11:30 PM 12/15 | 0.95 | 0.0637 |
| 11:15 PM 12/15 | 0.95 | 0.0637 |
| 11:00 PM 12/15 | 0.95 | 0.0637 |
| 10:45 PM 12/15 | 0.95 | 0.0637 |
| 10:30 PM 12/15 | 0.95 | 0.0637 |
| 10:15 PM 12/15 | 0.96 | 0.0653 |
| 10:00 PM 12/15 | 0.96 | 0.0653 |
| 9:45 PM 12/15 | 0.96 | 0.0653 |
5' -
This level representative flows that occur about once every 2-5 years. While impacts along Terror River are minimal, this level is likely representative of the point at which other ungaged streams may start to experience impacts.
3.3' -
This is the level at which some locations along the Terror River start to flow overbank. This level is typically reached 1-2 times per year.
| Date | Stage (ft) |
|---|---|
| Sep 19, 1995 | 7.67 |
| Oct 9, 2009 | 7.13 |
| Dec 9, 2019 | 6.96 |
| Oct 12, 2016 | 6.42 |
| Nov 12, 2014 | 5.84 |
| Oct 15, 2003 | 5.82 |
| Nov 23, 2002 | 5.57 |
| Sep 26, 1966 | 5.26 |
| Nov 9, 1997 | 5.12 |
| Oct 27, 2015 | 4.96 |
| Nov 29, 1984 | 4.8 |
| Oct 4, 2002 | 4.78 |
| Oct 4, 2001 | 4.78 |
| Sep 29, 1985 | 4.75 |
| Aug 10, 1968 | 4.72 |
| Sep 16, 1967 | 4.69 |
| Sep 27, 2012 | 4.69 |
| Jan 17, 2014 | 4.68 |
| Sep 5, 2011 | 4.45 |
| Sep 16, 2009 | 4.37 |
Data provided by the National Weather Service.