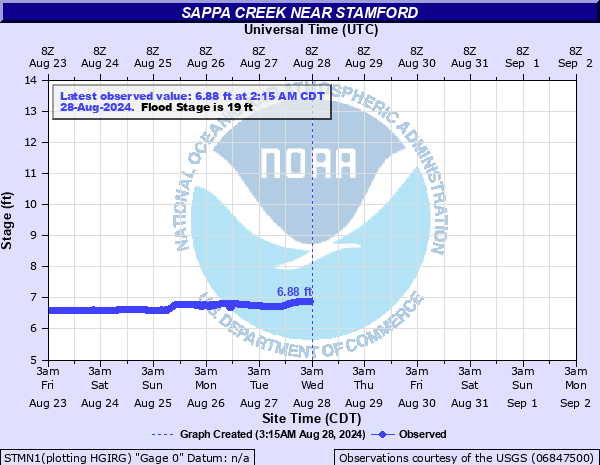
Sappa Creek near Stamford
Critical Stages
17' - Action
19' - Flood
22' - Moderate
26' - Major
Latest Observation
Updated: 6:15 PM CST 12/15/25
Status: No Flooding
Stage: 6.79 ft
Flow: 0.0158 kcfs
Forecast
Forecast not available for this location.
| Time | Stage (ft) | Flow (kcfs) |
|---|---|---|
| 7:15 PM 12/15 | 6.76 | 0.0152 |
| 7:00 PM 12/15 | 6.76 | 0.0152 |
| 6:45 PM 12/15 | 6.77 | 0.0154 |
| 6:30 PM 12/15 | 6.78 | 0.0156 |
| 6:15 PM 12/15 | 6.79 | 0.0158 |
| 6:00 PM 12/15 | 6.8 | 0.016 |
| 5:45 PM 12/15 | 6.81 | 0.0162 |
| 5:30 PM 12/15 | 6.82 | 0.0164 |
| 5:15 PM 12/15 | 6.83 | 0.0166 |
| 5:00 PM 12/15 | 6.84 | 0.0168 |
| 4:45 PM 12/15 | 6.84 | 0.0168 |
| 4:30 PM 12/15 | 6.85 | 0.017 |
| 4:15 PM 12/15 | 6.85 | 0.017 |
| 4:00 PM 12/15 | 6.86 | 0.0172 |
| 3:45 PM 12/15 | 6.86 | 0.0172 |
| 3:30 PM 12/15 | 6.86 | 0.0172 |
| 3:15 PM 12/15 | 6.85 | 0.017 |
| 3:00 PM 12/15 | 6.85 | 0.017 |
| 2:45 PM 12/15 | 6.84 | 0.0168 |
| 2:30 PM 12/15 | 6.83 | 0.0166 |
| 2:15 PM 12/15 | 6.82 | 0.0164 |
| 2:00 PM 12/15 | 6.81 | 0.0162 |
| 1:45 PM 12/15 | 6.8 | 0.016 |
| 1:30 PM 12/15 | 6.79 | 0.0158 |
| 1:15 PM 12/15 | 6.79 | 0.0158 |
| 1:00 PM 12/15 | 6.78 | 0.0156 |
| 12:45 PM 12/15 | 6.78 | 0.0156 |
| 12:30 PM 12/15 | 6.77 | 0.0154 |
| 12:15 PM 12/15 | 6.77 | 0.0154 |
| 12:00 PM 12/15 | 6.77 | 0.0154 |
26' -
Flood waters will cover several county roads along the creek and the bridge south of Flynn Junction. Several farm outbuildings and houses south of the creek will be threatened.
25' -
Water begins to impact the bottom of the bridge at the gage site.
22' -
The county road, known as F road, going south of the gage site begins to flood.
19' -
Flooding occurs over agricultural low land areas primarily south of the creek
| Date | Stage (ft) |
|---|---|
| Jun 24, 1966 | 22.13 |
| Jun 22, 1947 | 20.1 |
| Jul 19, 1944 | 18 |
| Jul 19, 1951 | 17.1 |
| Mar 24, 1960 | 17.08 |
| Aug 8, 1950 | 17.07 |
| May 27, 2019 | 16.55 |
| Jun 16, 1967 | 16.41 |
| Jun 17, 1957 | 16.03 |
| Jun 16, 1983 | 15.88 |
| Jun 17, 1965 | 15.34 |
| Aug 13, 1963 | 15.16 |
| Jul 15, 1952 | 14.95 |
| May 9, 1949 | 14.45 |
| Jun 21, 1964 | 14.25 |
| May 21, 1961 | 14.25 |
| Jun 22, 2010 | 13.93 |
| Jun 28, 1948 | 13.29 |
| May 26, 2008 | 12.57 |
| Jul 24, 2009 | 12.27 |
Data provided by the National Weather Service.