« Back to Little Horse Creek Rivers
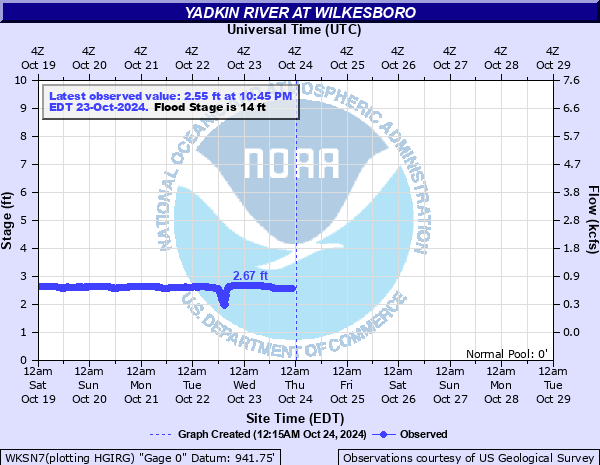
Yadkin River at Wilkesboro
Critical Stages
12' - Action
14' - Flood
17' - Moderate
22' - Major
Latest Observation
Updated: 11:45 PM EST 12/11/25
Status: No Flooding
Stage: 2.4 ft
Flow: 0.477 kcfs
Forecast
Forecast not available for this location.
| Time | Stage (ft) | Flow (kcfs) |
|---|---|---|
| 12:00 AM 12/12 | 2.4 | 0.477 |
| 11:45 PM 12/11 | 2.4 | 0.477 |
| 11:30 PM 12/11 | 2.4 | 0.477 |
| 11:15 PM 12/11 | 2.41 | 0.483 |
| 11:00 PM 12/11 | 2.4 | 0.477 |
| 10:45 PM 12/11 | 2.4 | 0.477 |
| 10:30 PM 12/11 | 2.4 | 0.477 |
| 10:15 PM 12/11 | 2.4 | 0.477 |
| 10:00 PM 12/11 | 2.41 | 0.483 |
| 9:45 PM 12/11 | 2.4 | 0.477 |
| 9:30 PM 12/11 | 2.41 | 0.483 |
| 9:15 PM 12/11 | 2.41 | 0.483 |
| 9:00 PM 12/11 | 2.41 | 0.483 |
| 8:45 PM 12/11 | 2.41 | 0.483 |
| 8:30 PM 12/11 | 2.41 | 0.483 |
| 8:15 PM 12/11 | 2.41 | 0.483 |
| 8:00 PM 12/11 | 2.41 | 0.483 |
| 7:45 PM 12/11 | 2.41 | 0.483 |
| 7:30 PM 12/11 | 2.41 | 0.483 |
| 7:15 PM 12/11 | 2.4 | 0.477 |
| 7:00 PM 12/11 | 2.41 | 0.483 |
| 6:45 PM 12/11 | 2.41 | 0.483 |
| 6:30 PM 12/11 | 2.41 | 0.483 |
| 6:15 PM 12/11 | 2.41 | 0.483 |
| 6:00 PM 12/11 | 2.42 | 0.489 |
| 5:45 PM 12/11 | 2.42 | 0.489 |
| 5:30 PM 12/11 | 2.43 | 0.495 |
| 5:15 PM 12/11 | 2.43 | 0.495 |
| 5:00 PM 12/11 | 2.44 | 0.5 |
| 4:45 PM 12/11 | 2.45 | 0.506 |
35' -
Wilkesboro, Ekin and other small towns downstream may be flooded.
32.5' -
The western approaches into north wilkesboro are flooded
28' -
Flood waters cut off the eastern approaches to north wilkesboro
25' -
The area between the river and the railroad tracks is flooded
22' -
Overflow of the right bank begins and flood waters affect the south approach to North Wilkesboro.
20' -
A few cottages and recreational camps are flooded
18' -
Extensive flooding of agricultural lands and the ball park
17' -
Low-lying secondary streets in Wilkesboro are affected and flooding begins at the old airfield.
16' -
Water continues to overflow the left bank covering local agricultural land and reaching the end of Wilkesboro Avenue.
14' -
Lowland flooding begins and water affects a portion of Wilkesboro Avenue in North Wilkesboro.
| Date | Stage (ft) |
|---|---|
| Aug 14, 1940 | 37.6 |
| Sep 18, 1945 | 22.45 |
| Apr 5, 1957 | 18.5 |
| Sep 30, 1959 | 18.3 |
| Jun 14, 1947 | 17.55 |
| Sep 27, 2024 | 17.5 |
| Mar 11, 1952 | 17.12 |
| Dec 7, 1950 | 16.77 |
| Apr 10, 1983 | 16.22 |
| Sep 6, 1942 | 16.04 |
| Oct 29, 2020 | 15.86 |
| Aug 10, 1970 | 15.66 |
| Dec 29, 1958 | 15.61 |
| Nov 6, 1977 | 15.52 |
| Aug 17, 1994 | 15.52 |
| Jan 22, 1954 | 15.49 |
| Feb 5, 1960 | 15.48 |
| Oct 17, 1975 | 15.4 |
| Feb 21, 1953 | 15.1 |
| Sep 30, 1944 | 14.77 |
Data provided by the National Weather Service.