Mill Creek (IN) at Cagles Mill
Critical Stages
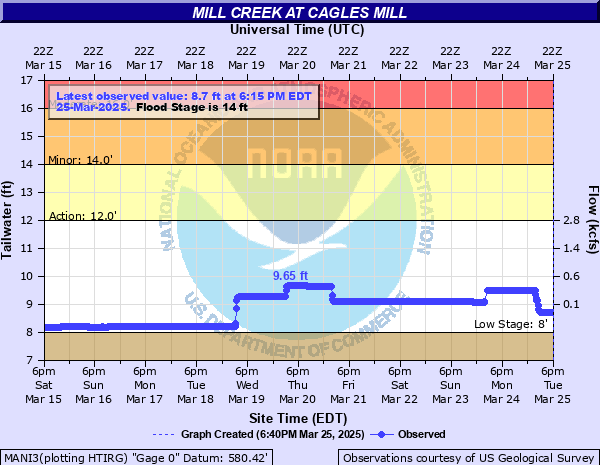
12' - Action
14' - Flood
16' - Moderate
Major
Latest Observation
Updated: 12:15 AM EST 12/10/25
Status: Low Threshold
Stage: 7.04 ft
Flow: -999 kcfs
Forecast
Forecast not available for this location.
| Time | Stage (ft) | Flow (kcfs) |
|---|---|---|
| 12:15 AM 12/10 | 7.04 | -999 |
| 12:00 AM 12/10 | 7.04 | -999 |
| 11:45 PM 12/9 | 7.04 | -999 |
| 11:30 PM 12/9 | 7.04 | -999 |
| 11:15 PM 12/9 | 7.04 | -999 |
| 11:00 PM 12/9 | 7.04 | -999 |
| 10:45 PM 12/9 | 7.04 | -999 |
| 10:30 PM 12/9 | 7.04 | -999 |
| 10:15 PM 12/9 | 7.04 | -999 |
| 10:00 PM 12/9 | 7.04 | -999 |
| 9:45 PM 12/9 | 7.04 | -999 |
| 9:30 PM 12/9 | 7.04 | -999 |
| 9:15 PM 12/9 | 7.04 | -999 |
| 9:00 PM 12/9 | 7.04 | -999 |
| 8:45 PM 12/9 | 7.04 | -999 |
| 8:30 PM 12/9 | 7.04 | -999 |
| 8:15 PM 12/9 | 7.04 | -999 |
| 8:00 PM 12/9 | 7.04 | -999 |
| 7:45 PM 12/9 | 7.04 | -999 |
| 7:30 PM 12/9 | 7.04 | -999 |
| 7:15 PM 12/9 | 7.04 | -999 |
| 7:00 PM 12/9 | 7.04 | -999 |
| 6:45 PM 12/9 | 7.04 | -999 |
| 6:30 PM 12/9 | 7.04 | -999 |
| 6:15 PM 12/9 | 7.04 | -999 |
| 6:00 PM 12/9 | 7.04 | -999 |
| 5:45 PM 12/9 | 7.04 | -999 |
| 5:30 PM 12/9 | 7.04 | -999 |
| 5:15 PM 12/9 | 7.04 | -999 |
| 5:00 PM 12/9 | 7.04 | -999 |
No flood impact data available for this location.
| Date | Stage (ft) |
|---|---|
| Aug 1, 1875 | 21 |
| Jan 5, 1950 | 18.38 |
| Jun 7, 2008 | 15.78 |
| Apr 19, 2013 | 15.68 |
| Apr 3, 2018 | 14.91 |
| Apr 20, 2011 | 14.87 |
| Jan 13, 2013 | 14.83 |
| Apr 5, 2025 | 14.65 |
| Apr 28, 2011 | 14.59 |
| Mar 5, 2011 | 13.61 |
| Feb 28, 2011 | 13.26 |
| Dec 27, 2015 | 13.04 |
| Jul 8, 2015 | 13.01 |
| May 4, 2017 | 12.96 |
| Jun 14, 2010 | 12.09 |
| Apr 4, 2014 | 11.22 |
| Jun 22, 2010 | 11.07 |
| Feb 25, 2018 | 10.5 |
Data provided by the National Weather Service.