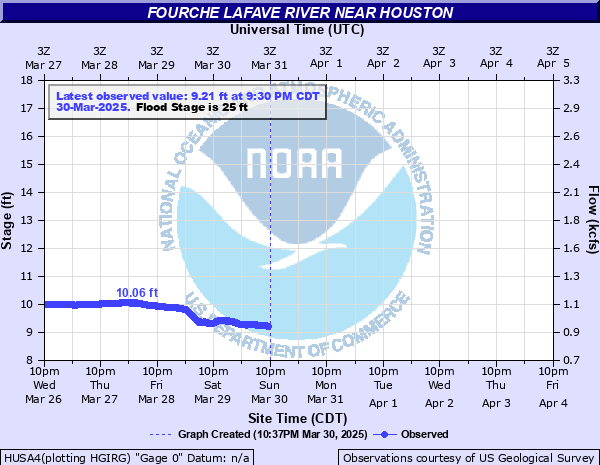
Fourche LaFave River near Houston
Critical Stages
24.5' - Action
25' - Flood
32' - Moderate
35' - Major
Latest Observation
Updated: 7:30 PM CST 12/8/25
Status: No Flooding
Stage: 8.68 ft
Flow: 0.0525 kcfs
Forecast
Forecast not available for this location.
| Time | Stage (ft) | Flow (kcfs) |
|---|---|---|
| 7:30 PM 12/8 | 8.68 | 0.0525 |
| 7:15 PM 12/8 | 8.69 | 0.0541 |
| 7:00 PM 12/8 | 8.7 | 0.0557 |
| 6:45 PM 12/8 | 8.69 | 0.0541 |
| 6:30 PM 12/8 | 8.69 | 0.0541 |
| 6:15 PM 12/8 | 8.69 | 0.0541 |
| 6:00 PM 12/8 | 8.69 | 0.0541 |
| 5:45 PM 12/8 | 8.69 | 0.0541 |
| 5:30 PM 12/8 | 8.7 | 0.0557 |
| 5:15 PM 12/8 | 8.72 | 0.059 |
| 5:00 PM 12/8 | 8.73 | 0.0608 |
| 4:45 PM 12/8 | 8.73 | 0.0608 |
| 4:30 PM 12/8 | 8.75 | 0.0645 |
| 4:15 PM 12/8 | 8.74 | 0.0626 |
| 4:00 PM 12/8 | 8.74 | 0.0626 |
| 3:45 PM 12/8 | 8.76 | 0.0664 |
| 3:30 PM 12/8 | 8.76 | 0.0664 |
| 3:15 PM 12/8 | 8.75 | 0.0645 |
| 3:00 PM 12/8 | 8.75 | 0.0645 |
| 2:45 PM 12/8 | 8.73 | 0.0608 |
| 2:30 PM 12/8 | 8.71 | 0.0573 |
| 2:15 PM 12/8 | 8.69 | 0.0541 |
| 2:00 PM 12/8 | 8.69 | 0.0541 |
| 1:45 PM 12/8 | 8.68 | 0.0525 |
| 1:30 PM 12/8 | 8.68 | 0.0525 |
| 1:15 PM 12/8 | 8.7 | 0.0557 |
| 1:00 PM 12/8 | 8.7 | 0.0557 |
| 12:45 PM 12/8 | 8.69 | 0.0541 |
| 12:30 PM 12/8 | 8.68 | 0.0525 |
| 12:15 PM 12/8 | 8.67 | 0.051 |
44.4' -
This is equal to the stage of record for forecast location which occurred in April 1927, prior to completion of Nimrod Dam.
38' -
Stage of record for the gage is 37.6 feet experienced in May 1990, December 1982, and April 1945. A crest of 44.4 feet was reported to have occurred in April 1927, prior to the completion of Nimrod Dam in 1942 and establishment of gage records at site.
35' -
Areas similar to those inundated in January 2016 when the river crested at 35.8 feet.
32' -
Roads around Harris Brake Lake are flooded. Flooding extends from Arkansas River upstream of Harris Brake.
30' -
State Highway 216 affected. Extensive acreage near Harris Brake Lake and the Wildlife Management Area are flooded.
25' -
Agricultural lands along the Arkansas River and up into the Fourche LaFave begin to flood. Equipment and livestock should be moved to higher ground.
| Date | Stage (ft) |
|---|---|
| Apr 1, 1927 | 44.4 |
| Jun 4, 2019 | 39.26 |
| Dec 5, 1982 | 37.55 |
| Apr 3, 1945 | 37.53 |
| May 8, 1990 | 37.35 |
| Jan 1, 2016 | 35.82 |
| Apr 27, 1973 | 34.13 |
| Jun 3, 2015 | 33.84 |
| Nov 30, 1985 | 33.58 |
| Apr 29, 2011 | 32.61 |
| Mar 22, 2008 | 32.53 |
| Apr 13, 2008 | 32.33 |
| Dec 28, 1987 | 32.26 |
| May 14, 2015 | 32.08 |
| Mar 30, 1975 | 32 |
| Oct 22, 1984 | 31.97 |
| Dec 12, 1971 | 31.79 |
| Apr 7, 2025 | 31.55 |
| May 8, 2009 | 31.5 |
| Feb 26, 2018 | 31.36 |
Data provided by the National Weather Service.