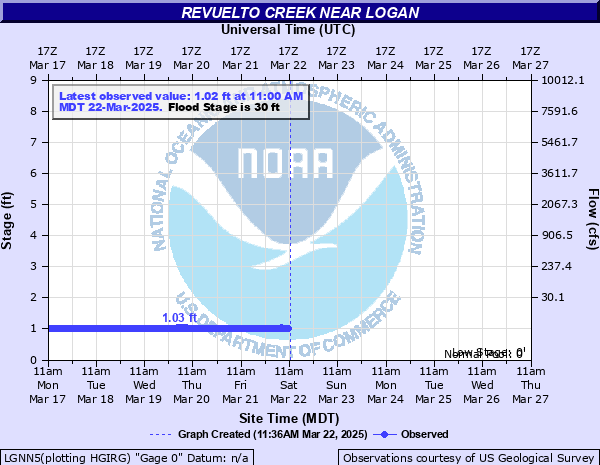
Revuelto Creek near Logan
Critical Stages
25' - Action
30' - Flood
35' - Moderate
Major
Latest Observation
Updated: 12:00 PM MST 12/15/25
Status: No Flooding
Stage: 0.86 ft
Flow: -999 kcfs
Forecast
Forecast not available for this location.
| Time | Stage (ft) | Flow (kcfs) |
|---|---|---|
| 12:00 PM 12/15 | 0.86 | -999 |
| 11:45 AM 12/15 | 0.86 | -999 |
| 11:30 AM 12/15 | 0.86 | -999 |
| 11:15 AM 12/15 | 0.86 | -999 |
| 11:00 AM 12/15 | 0.86 | -999 |
| 10:45 AM 12/15 | 0.87 | -999 |
| 10:30 AM 12/15 | 0.86 | -999 |
| 10:15 AM 12/15 | 0.87 | -999 |
| 10:00 AM 12/15 | 0.87 | -999 |
| 9:45 AM 12/15 | 0.87 | -999 |
| 9:30 AM 12/15 | 0.87 | -999 |
| 9:15 AM 12/15 | 0.87 | -999 |
| 9:00 AM 12/15 | 0.87 | -999 |
| 8:45 AM 12/15 | 0.88 | -999 |
| 8:30 AM 12/15 | 0.87 | -999 |
| 8:15 AM 12/15 | 0.87 | -999 |
| 8:00 AM 12/15 | 0.87 | -999 |
| 7:45 AM 12/15 | 0.87 | -999 |
| 7:30 AM 12/15 | 0.87 | -999 |
| 7:15 AM 12/15 | 0.87 | -999 |
| 7:00 AM 12/15 | 0.87 | -999 |
| 6:45 AM 12/15 | 0.87 | -999 |
| 6:30 AM 12/15 | 0.87 | -999 |
| 6:15 AM 12/15 | 0.87 | -999 |
| 6:00 AM 12/15 | 0.87 | -999 |
| 5:45 AM 12/15 | 0.87 | -999 |
| 5:30 AM 12/15 | 0.87 | -999 |
| 5:15 AM 12/15 | 0.87 | -999 |
| 5:00 AM 12/15 | 0.87 | -999 |
| 4:45 AM 12/15 | 0.87 | -999 |
35' -
Floodwaters are likely overtopping the road surface on the New Mexico highway 469 bridge between Ute Lake State Park and San Jon, making this section of road impassable. Significant flooding of low lying range land along the creek is occurring as well as major bank erosion due to the very high flow volume.
30' -
High flow volume in the channel is reulting in considerable bank erosion. Low lying areas, mostly range land, are flooding. Water has reached the level of low steel on the New Mexico highway 469 bridge between Ute Lake State Park and San Jon.
25' -
Water has reached the highest levels since the 1940s and considerable bank erosion is occurring due to the high flow volume within the channel. Low lying areas along the river are subject to overbank flooding but no known structures are in immediate danger of inundation.
| Date | Stage (ft) |
|---|---|
| Jul 9, 1960 | 14.3 |
| May 1, 1957 | 12.9 |
| Jun 14, 1988 | 12.84 |
| Jul 20, 1972 | 12.72 |
| Aug 11, 1981 | 11.7 |
| Aug 23, 1967 | 11.42 |
| Apr 18, 1970 | 11.15 |
| Aug 13, 1984 | 10.35 |
| May 22, 1991 | 9.6 |
| Jul 10, 1996 | 9.06 |
| Sep 18, 1946 | 9.04 |
| Jun 22, 2002 | 8.93 |
| Aug 2, 1966 | 8.65 |
| Aug 28, 2005 | 8.51 |
| Aug 17, 2008 | 8.06 |
| Jul 27, 1992 | 7.58 |
| Aug 28, 2000 | 7.55 |
Data provided by the National Weather Service.