Grant River at Burton
Critical Stages
15' - Action
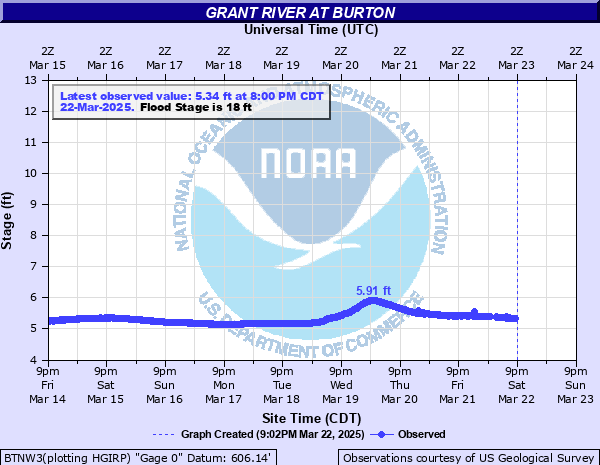
18' - Flood
20' - Moderate
22' - Major
Latest Observation
Updated: 4:00 AM CST 12/16/25
Status: No Flooding
Stage: 6.46 ft
Flow: 0.314 kcfs
Forecast
Forecast not available for this location.
| Time | Stage (ft) | Flow (kcfs) |
|---|---|---|
| 4:00 AM 12/16 | 6.46 | 0.314 |
| 3:45 AM 12/16 | 6.48 | 0.317 |
| 3:30 AM 12/16 | 6.49 | 0.319 |
| 3:15 AM 12/16 | 6.49 | 0.319 |
| 3:00 AM 12/16 | 6.49 | 0.319 |
| 2:45 AM 12/16 | 6.49 | 0.319 |
| 2:30 AM 12/16 | 6.49 | 0.319 |
| 2:15 AM 12/16 | 6.49 | 0.319 |
| 2:00 AM 12/16 | 6.49 | 0.319 |
| 1:45 AM 12/16 | 6.49 | 0.319 |
| 1:30 AM 12/16 | 6.48 | 0.317 |
| 1:15 AM 12/16 | 6.48 | 0.317 |
| 1:00 AM 12/16 | 6.46 | 0.314 |
| 12:45 AM 12/16 | 6.46 | 0.314 |
| 12:30 AM 12/16 | 6.45 | 0.313 |
| 12:15 AM 12/16 | 6.44 | 0.312 |
| 12:00 AM 12/16 | 6.43 | 0.31 |
| 11:45 PM 12/15 | 6.43 | 0.31 |
| 11:30 PM 12/15 | 6.43 | 0.31 |
| 11:15 PM 12/15 | 6.42 | 0.309 |
| 11:00 PM 12/15 | 6.41 | 0.307 |
| 10:45 PM 12/15 | 6.4 | 0.306 |
| 10:30 PM 12/15 | 6.41 | 0.307 |
| 10:15 PM 12/15 | 6.42 | 0.309 |
| 10:00 PM 12/15 | 6.42 | 0.309 |
| 9:45 PM 12/15 | 6.43 | 0.31 |
| 9:30 PM 12/15 | 6.43 | 0.31 |
| 9:15 PM 12/15 | 6.46 | 0.314 |
| 9:00 PM 12/15 | 6.47 | 0.316 |
| 8:45 PM 12/15 | 6.49 | 0.319 |
25.5' -
Water begins flowing over the road.
24' -
Water reaches the bottom of the Highway N Bridge at Burton.
18' -
Minor flooding of lowland areas begins.
| Date | Stage (ft) |
|---|---|
| Jul 22, 2017 | 26.45 |
| Jul 16, 1950 | 24.82 |
| Feb 19, 1997 | 24.62 |
| Feb 20, 1994 | 24.57 |
| Jun 22, 1954 | 24.45 |
| Jan 25, 1967 | 23.67 |
| Sep 12, 2019 | 23.54 |
| Jun 13, 2008 | 23.31 |
| Sep 20, 2019 | 23.3 |
| Feb 20, 1955 | 23.3 |
| Jun 17, 1978 | 23.07 |
| Feb 8, 1966 | 23.05 |
| Oct 2, 2018 | 23.03 |
| Apr 25, 2008 | 23.01 |
| Jun 15, 1991 | 22.23 |
| Jun 1, 2000 | 22.05 |
| Mar 1, 1965 | 22.05 |
| Mar 16, 1963 | 21.88 |
| Mar 22, 1975 | 21.84 |
| Jun 4, 2002 | 21.77 |
Data provided by the National Weather Service.