Elkhorn River at Norfolk
Critical Stages
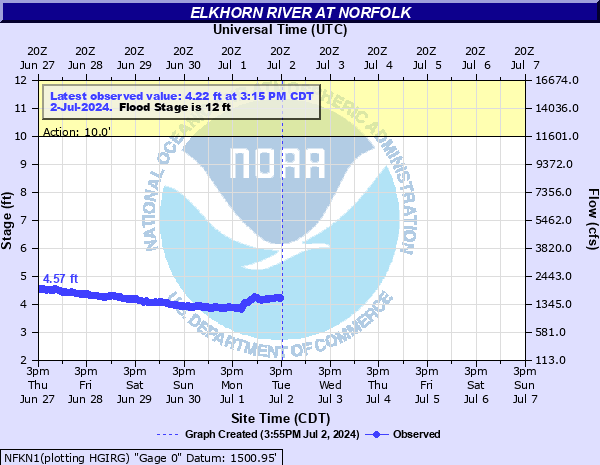
10' - Action
12' - Flood
13' - Moderate
17' - Major
Latest Observation
Updated: 2:15 PM CST 12/15/25
Status: No Flooding
Stage: 3.77 ft
Flow: 0.877 kcfs
Forecast
Forecast not available for this location.
| Time | Stage (ft) | Flow (kcfs) |
|---|---|---|
| 2:15 PM 12/15 | 3.77 | 0.877 |
| 2:00 PM 12/15 | 3.75 | 0.864 |
| 1:45 PM 12/15 | 3.74 | 0.857 |
| 1:30 PM 12/15 | 3.73 | 0.85 |
| 1:15 PM 12/15 | 3.72 | 0.844 |
| 1:00 PM 12/15 | 3.71 | 0.837 |
| 12:45 PM 12/15 | 3.7 | 0.831 |
| 12:30 PM 12/15 | 3.7 | 0.831 |
| 12:15 PM 12/15 | 3.69 | 0.824 |
| 12:00 PM 12/15 | 3.68 | 0.818 |
| 11:45 AM 12/15 | 3.67 | 0.811 |
| 11:30 AM 12/15 | 3.65 | 0.798 |
| 11:15 AM 12/15 | 3.65 | 0.798 |
| 11:00 AM 12/15 | 3.64 | 0.791 |
| 10:45 AM 12/15 | 3.62 | 0.778 |
| 10:30 AM 12/15 | 3.62 | 0.778 |
| 10:15 AM 12/15 | 3.61 | 0.771 |
| 10:00 AM 12/15 | 3.6 | 0.765 |
| 9:45 AM 12/15 | 3.6 | 0.765 |
| 9:30 AM 12/15 | 3.6 | 0.765 |
| 9:15 AM 12/15 | 3.6 | 0.765 |
| 9:00 AM 12/15 | 3.6 | 0.765 |
| 8:45 AM 12/15 | 3.61 | 0.771 |
| 8:30 AM 12/15 | 3.61 | 0.771 |
| 8:15 AM 12/15 | 3.61 | 0.771 |
| 8:00 AM 12/15 | 3.6 | 0.765 |
| 7:45 AM 12/15 | 3.59 | 0.758 |
| 7:30 AM 12/15 | 3.58 | 0.752 |
| 7:15 AM 12/15 | 3.58 | 0.752 |
| 7:00 AM 12/15 | 3.59 | 0.758 |
19.5' -
Water reaches the bottom of the Highway 81 bridge.
17' -
The local levee protecting Tahazouka Park is overtopped.
16' -
U.S. Highway 81 will begin to be overtopped.
13' -
The river is bankfull within the city limits of Norfolk. Outside the Norfolk area, serious flooding of lowlands and bridge approaches take place. Some county roads and rural homes flood.
12' -
Considerable lowland flooding and approaches to bridges flood upstream and downstream of the gage for several miles.
10' -
The trail under Highway 81 begins to flood.
| Date | Stage (ft) |
|---|---|
| Jun 15, 2010 | 17.22 |
| Mar 11, 1949 | 15.63 |
| Mar 14, 2019 | 15.59 |
| May 31, 1995 | 13.05 |
| May 13, 1944 | 11.8 |
| Jun 6, 1940 | 11.7 |
| Jun 8, 2008 | 11.42 |
| Feb 20, 1982 | 11.37 |
| Jun 26, 1947 | 11.1 |
| Jun 21, 1942 | 10.2 |
| Feb 19, 1997 | 10.18 |
| Mar 20, 1987 | 9.96 |
| May 30, 1903 | 9.6 |
| Jun 18, 1998 | 9.53 |
| Jul 30, 1958 | 9.43 |
| Apr 8, 1949 | 9.4 |
| Feb 10, 2009 | 9.28 |
| Jun 16, 1990 | 9.25 |
| May 30, 2007 | 9.13 |
| Jun 4, 1991 | 9.1 |
Data provided by the National Weather Service.