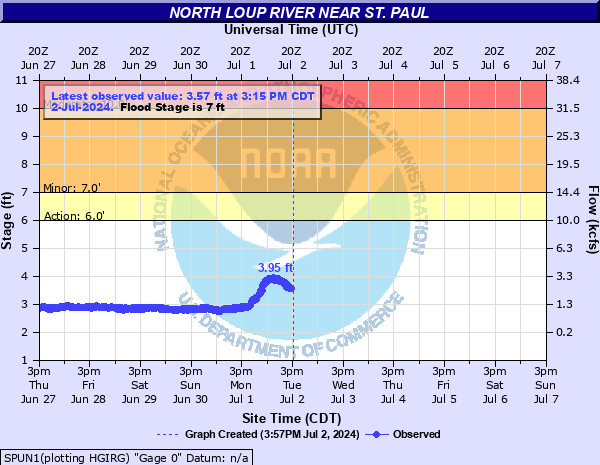
North Loup River near St. Paul
Critical Stages
6' - Action
7' - Flood
10' - Moderate
12' - Major
Latest Observation
Updated: 2:15 PM CST 12/15/25
Status: No Flooding
Stage: 2.64 ft
Flow: 0.984 kcfs
Forecast
Forecast not available for this location.
| Time | Stage (ft) | Flow (kcfs) |
|---|---|---|
| 2:15 PM 12/15 | 2.64 | 0.984 |
| 2:00 PM 12/15 | 2.63 | 0.974 |
| 1:45 PM 12/15 | 2.62 | 0.964 |
| 1:30 PM 12/15 | 2.65 | 0.995 |
| 1:15 PM 12/15 | 2.65 | 0.995 |
| 1:00 PM 12/15 | 2.61 | 0.954 |
| 12:45 PM 12/15 | 2.61 | 0.954 |
| 12:30 PM 12/15 | 2.6 | 0.944 |
| 12:15 PM 12/15 | 2.62 | 0.964 |
| 12:00 PM 12/15 | 2.63 | 0.974 |
| 11:45 AM 12/15 | 2.66 | 1 |
| 11:30 AM 12/15 | 2.66 | 1 |
| 11:15 AM 12/15 | 2.62 | 0.964 |
| 11:00 AM 12/15 | 2.64 | 0.984 |
| 10:45 AM 12/15 | 2.64 | 0.984 |
| 10:30 AM 12/15 | 2.62 | 0.964 |
| 10:15 AM 12/15 | 2.61 | 0.954 |
| 10:00 AM 12/15 | 2.62 | 0.964 |
| 9:45 AM 12/15 | 2.61 | 0.954 |
| 9:30 AM 12/15 | 2.62 | 0.964 |
| 9:15 AM 12/15 | 2.65 | 0.995 |
| 9:00 AM 12/15 | 2.66 | 1 |
| 8:45 AM 12/15 | 2.67 | 1.02 |
| 8:30 AM 12/15 | 2.65 | 0.995 |
| 8:15 AM 12/15 | 2.65 | 0.995 |
| 8:00 AM 12/15 | 2.62 | 0.964 |
| 7:45 AM 12/15 | 2.61 | 0.954 |
| 7:30 AM 12/15 | 2.6 | 0.944 |
| 7:15 AM 12/15 | 2.59 | 0.933 |
| 7:00 AM 12/15 | 2.59 | 0.933 |
14.5' -
Water will reach the bottom of the Highway 281 bridge.
12' -
Numerous homes within the Lake of the Woods Residential Area would be inundated by flood waters. This is more than 2 feet above the historical record crest of 9.6 feet set in 1947.
10' -
Outbuildings within the Lake of the Woods Residential Area may be impacted by flooding.
8.5' -
The North Loup State Recreation Area will experience significant flooding.
7' -
Flooding occurs in lowland and wooded areas adjacent to the river. In addition, the North Loup State Recreation Area will begin to be impacted by flood waters.
| Date | Stage (ft) |
|---|---|
| Mar 14, 2019 | 11.49 |
| Jun 22, 1947 | 9.6 |
| Aug 13, 1966 | 9.36 |
| Mar 7, 1993 | 8.85 |
| Mar 27, 1960 | 8.35 |
| Feb 22, 1982 | 8.26 |
| Mar 15, 1979 | 8.13 |
| Mar 20, 1969 | 8.04 |
| Dec 21, 1979 | 8.02 |
| Feb 26, 1957 | 7.73 |
| Mar 18, 1978 | 7.7 |
| Aug 5, 1981 | 7.38 |
| Mar 24, 1962 | 6.95 |
| Feb 21, 1965 | 6.83 |
| Mar 4, 1994 | 6.79 |
| Feb 25, 1958 | 6.78 |
| Feb 19, 1971 | 6.72 |
| Feb 22, 2007 | 6.71 |
| Jun 7, 1962 | 6.67 |
| Mar 11, 1989 | 6.63 |
Data provided by the National Weather Service.