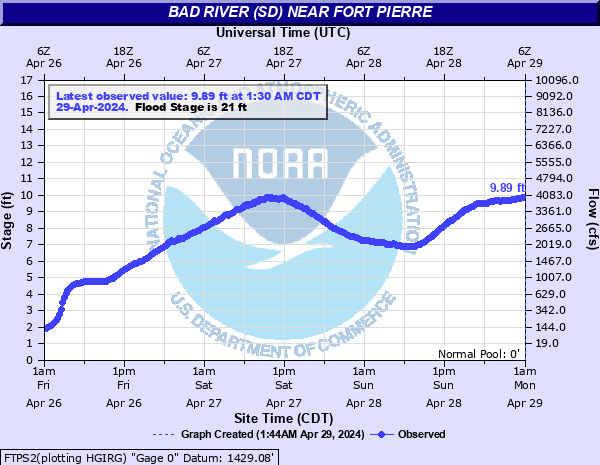
Bad River (SD) near Fort Pierre
Critical Stages
19' - Action
21' - Flood
25' - Moderate
27' - Major
Latest Observation
Updated: 11:30 PM CST 12/15/25
Status: No Flooding
Stage: 1.1 ft
Flow: 0 kcfs
Forecast
Forecast not available for this location.
| Time | Stage (ft) | Flow (kcfs) |
|---|---|---|
| 11:30 PM 12/15 | 1.1 | 0 |
| 11:15 PM 12/15 | 1.09 | -999 |
| 11:00 PM 12/15 | 1.09 | -999 |
| 10:45 PM 12/15 | 1.09 | -999 |
| 10:30 PM 12/15 | 1.09 | -999 |
| 10:15 PM 12/15 | 1.08 | -999 |
| 10:00 PM 12/15 | 1.08 | -999 |
| 9:45 PM 12/15 | 1.08 | -999 |
| 9:30 PM 12/15 | 1.07 | -999 |
| 9:15 PM 12/15 | 1.06 | -999 |
| 9:00 PM 12/15 | 1.06 | -999 |
| 8:45 PM 12/15 | 1.06 | -999 |
| 8:30 PM 12/15 | 1.06 | -999 |
| 8:15 PM 12/15 | 1.05 | -999 |
| 8:00 PM 12/15 | 1.05 | -999 |
| 7:45 PM 12/15 | 1.06 | -999 |
| 7:30 PM 12/15 | 1.06 | -999 |
| 7:15 PM 12/15 | 1.06 | -999 |
| 7:00 PM 12/15 | 1.06 | -999 |
| 6:45 PM 12/15 | 1.06 | -999 |
| 6:30 PM 12/15 | 1.06 | -999 |
| 6:15 PM 12/15 | 1.07 | -999 |
| 6:00 PM 12/15 | 1.07 | -999 |
| 5:45 PM 12/15 | 1.09 | -999 |
| 5:30 PM 12/15 | 1.1 | 0 |
| 5:15 PM 12/15 | 1.1 | 0 |
| 5:00 PM 12/15 | 1.12 | 0 |
| 4:45 PM 12/15 | 1.13 | 0 |
| 4:30 PM 12/15 | 1.14 | 0 |
| 4:15 PM 12/15 | 1.16 | 0 |
36' -
The bridge on Bad River Rd at the gauge location is overtopped.
32' -
The railroad tracks near the gauge are flooded.
30' -
Significant flooding is ongoing near the gauge locations with numerous structures flooded.
27' -
The unleveed portions of Fort Pierre begin flooding with some levees in danger of breaking. Ten mobile homes downstream of the gauge are in danger of flooding and some outbuildings are flooded.
25' -
Bad River Road is flooded in several locations with some ranches surrounded by water
24' -
Water reaches mobile homes along Highway 83 south of Fort Pierre
21' -
Bad River Road begins flooding about 7 miles upstream of the gauge
16' -
Minor flooding of the lowest pasture land begins
| Date | Stage (ft) |
|---|---|
| Jul 3, 1905 | 32.9 |
| Apr 1, 1927 | 30.89 |
| Aug 1, 1915 | 29.6 |
| Jun 18, 1967 | 29.55 |
| May 1, 1942 | 27.8 |
| Jun 21, 2011 | 27.53 |
| Jun 15, 1920 | 27.4 |
| Apr 7, 1952 | 27.03 |
| May 27, 1996 | 26.1 |
| Mar 20, 1978 | 25.52 |
| Jun 4, 1984 | 25.47 |
| May 9, 1986 | 24.64 |
| Mar 21, 1987 | 24.38 |
| May 14, 1982 | 24.05 |
| May 9, 1995 | 23.61 |
| Mar 25, 2019 | 23.42 |
| Apr 2, 1950 | 23.4 |
| Mar 27, 1960 | 23.36 |
| Jun 11, 1954 | 23.35 |
| Mar 4, 1994 | 22.58 |
Data provided by the National Weather Service.