« Back to Lumber Bridge Rivers
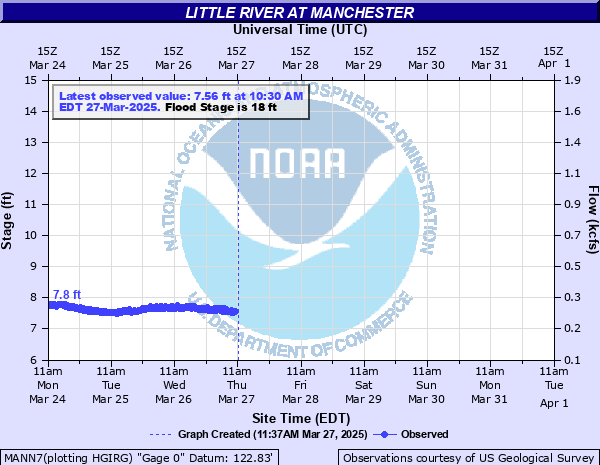
Little River at Manchester
Critical Stages
16' - Action
18' - Flood
24' - Moderate
27' - Major
Latest Observation
Updated: 12:30 PM EST 12/13/25
Status: No Flooding
Stage: 7.02 ft
Flow: 0.158 kcfs
Forecast
Forecast not available for this location.
| Time | Stage (ft) | Flow (kcfs) |
|---|---|---|
| 12:30 PM 12/13 | 7.02 | 0.158 |
| 12:15 PM 12/13 | 7.01 | 0.156 |
| 12:00 PM 12/13 | 7.01 | 0.156 |
| 11:45 AM 12/13 | 7.01 | 0.156 |
| 11:30 AM 12/13 | 7.01 | 0.156 |
| 11:15 AM 12/13 | 7.01 | 0.156 |
| 11:00 AM 12/13 | 7.01 | 0.156 |
| 10:45 AM 12/13 | 7.01 | 0.156 |
| 10:30 AM 12/13 | 7.01 | 0.156 |
| 10:15 AM 12/13 | 7.02 | 0.158 |
| 10:00 AM 12/13 | 7.02 | 0.158 |
| 9:45 AM 12/13 | 7.02 | 0.158 |
| 9:30 AM 12/13 | 7.01 | 0.156 |
| 9:15 AM 12/13 | 7.02 | 0.158 |
| 9:00 AM 12/13 | 7.02 | 0.158 |
| 8:45 AM 12/13 | 7.02 | 0.158 |
| 8:30 AM 12/13 | 7.02 | 0.158 |
| 8:15 AM 12/13 | 7.02 | 0.158 |
| 8:00 AM 12/13 | 7.02 | 0.158 |
| 7:45 AM 12/13 | 7.02 | 0.158 |
| 7:30 AM 12/13 | 7.02 | 0.158 |
| 7:15 AM 12/13 | 7.03 | 0.159 |
| 7:00 AM 12/13 | 7.02 | 0.158 |
| 6:45 AM 12/13 | 7.03 | 0.159 |
| 6:30 AM 12/13 | 7.03 | 0.159 |
| 6:15 AM 12/13 | 7.03 | 0.159 |
| 6:00 AM 12/13 | 7.03 | 0.159 |
| 5:45 AM 12/13 | 7.03 | 0.159 |
| 5:30 AM 12/13 | 7.03 | 0.159 |
| 5:15 AM 12/13 | 7.03 | 0.159 |
37' -
Flooding reaches the road level of the Bragg Blvd (Hwy 24/87) bridge over the Little River. Local businesses will be flooded.
30' -
Water reaches the base of the Bragg Blvd (Hwy 24/87) bridge across the Little River.
28' -
Flooding reaches the road surface of the Manchester Road bridge.
27' -
The Starlite motel is flooded and Manchester Road is closed.
25' -
Water reaches the base of the Manchester Road bridge and the foundation of the Starlite motel at the intersection of Manchester Road and Bragg Blvd (Hwy 24/87).
24' -
Manchester Road is flooded.
23' -
Minor flooding begins on Manchester Road near the Fort Bragg water treatment plant.
18' -
Minor flooding begins in Fort Bragg near the water treatment plant.
| Date | Stage (ft) |
|---|---|
| Sep 18, 2018 | 38.3 |
| Oct 10, 2016 | 32.19 |
| Oct 9, 2016 | 31.36 |
| Sep 29, 2016 | 31.2 |
| Sep 19, 1945 | 29 |
| Aug 10, 2024 | 27.71 |
| Nov 15, 2018 | 24.79 |
| Aug 11, 2003 | 24.72 |
| Jan 31, 2020 | 21.86 |
| Feb 21, 2021 | 20.61 |
| Feb 8, 2010 | 20.23 |
| Aug 15, 2025 | 19.58 |
| Jun 16, 2006 | 18.8 |
| Sep 10, 2004 | 18.26 |
| Feb 16, 2021 | 18.23 |
| Oct 14, 2018 | 17.26 |
| Mar 3, 1939 | 12.77 |
| Apr 7, 1941 | 12.28 |
| Aug 21, 1942 | 11.7 |
| Oct 10, 1949 | 11.2 |
Data provided by the National Weather Service.