« Back to Lumber Bridge Rivers
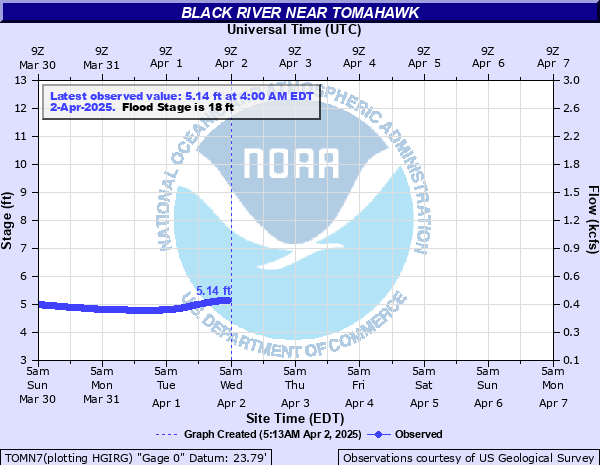
Black River near Tomahawk
Critical Stages
16' - Action
18' - Flood
20' - Moderate
22' - Major
Latest Observation
Updated: 12:00 PM EST 12/13/25
Status: No Flooding
Stage: 3.96 ft
Flow: 0.267 kcfs
Forecast
Forecast not available for this location.
| Time | Stage (ft) | Flow (kcfs) |
|---|---|---|
| 1:00 PM 12/13 | 3.94 | 0.265 |
| 12:45 PM 12/13 | 3.95 | 0.266 |
| 12:30 PM 12/13 | 3.95 | 0.266 |
| 12:15 PM 12/13 | 3.94 | 0.265 |
| 12:00 PM 12/13 | 3.96 | 0.267 |
| 11:45 AM 12/13 | 3.95 | 0.266 |
| 11:30 AM 12/13 | 3.96 | 0.267 |
| 11:15 AM 12/13 | 3.96 | 0.267 |
| 11:00 AM 12/13 | 3.96 | 0.267 |
| 10:45 AM 12/13 | 3.96 | 0.267 |
| 10:30 AM 12/13 | 3.96 | 0.267 |
| 10:15 AM 12/13 | 3.97 | 0.269 |
| 10:00 AM 12/13 | 3.97 | 0.269 |
| 9:45 AM 12/13 | 3.97 | 0.269 |
| 9:30 AM 12/13 | 3.97 | 0.269 |
| 9:15 AM 12/13 | 3.97 | 0.269 |
| 9:00 AM 12/13 | 3.98 | 0.27 |
| 8:45 AM 12/13 | 3.98 | 0.27 |
| 8:30 AM 12/13 | 3.98 | 0.27 |
| 8:15 AM 12/13 | 3.99 | 0.272 |
| 8:00 AM 12/13 | 3.99 | 0.272 |
| 7:45 AM 12/13 | 3.99 | 0.272 |
| 7:30 AM 12/13 | 3.99 | 0.272 |
| 7:15 AM 12/13 | 4 | 0.273 |
| 7:00 AM 12/13 | 4 | 0.273 |
| 6:45 AM 12/13 | 4 | 0.273 |
| 6:30 AM 12/13 | 4 | 0.273 |
| 6:15 AM 12/13 | 4 | 0.273 |
| 6:00 AM 12/13 | 4.01 | 0.274 |
| 5:45 AM 12/13 | 4.01 | 0.274 |
22' -
Major flooding begins. The Clear Run community adjacent to the NC-411 bridge will begin flooding. NC-411 will be closed west of the bridge. Further downstream there will be significant flooding of properties along Black River Lane north of NC-41.
20' -
Moderate flooding begins. NC-411 west of the bridge over the Black River will be impassable. Riley Town Road and Wright Bridge Road just west of US-701 near Ingold may be impassable. Lundy Rd will also be impassable northeast of NC-411. Further downstream, water will reach properties along Black River Lane north of NC-41. Evacuations may be needed.
18' -
Minor flooding begins. Water begins to flood NC-411 about one quarter of a mile west of the bridge over the Black River. The Black River and Great Coharie Creek may be near the road levels on Wright Bridge Road and Riley Town Road near the intersection of US-701 outside of Ingold.
| Date | Stage (ft) |
|---|---|
| Sep 18, 2018 | 31.34 |
| Oct 11, 2016 | 27.92 |
| Sep 18, 1999 | 27.14 |
| Sep 17, 1984 | 22.08 |
| Aug 11, 2024 | 21.4 |
| Sep 10, 1996 | 21.31 |
| Oct 21, 1999 | 21.17 |
| Aug 20, 1992 | 20.74 |
| Nov 25, 2006 | 20.15 |
| Sep 9, 2019 | 19.95 |
| Jan 12, 1993 | 19.54 |
| Feb 21, 2021 | 19.44 |
| Jun 22, 1995 | 18.9 |
| Aug 4, 1991 | 18.84 |
| Feb 10, 2016 | 18.8 |
| Mar 5, 1987 | 18.33 |
| Oct 12, 1996 | 18.22 |
Data provided by the National Weather Service.