« Back to Madison County Rivers
Econfina River near Perry (CR 655)
Critical Stages
23' - Action
24.5' - Flood
25.5' - Moderate
Major
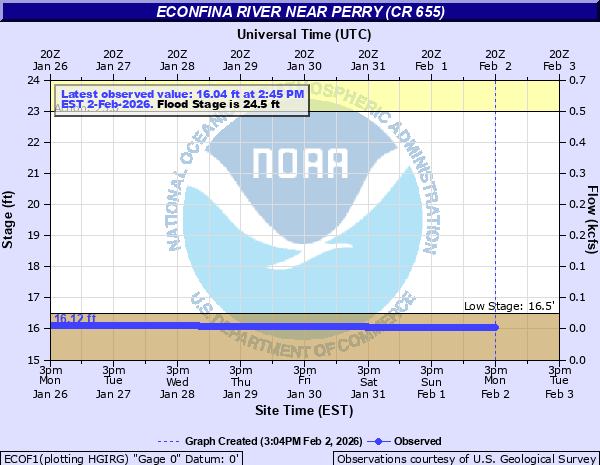
Latest Observation
Updated: 6:45 PM EST 12/15/25
Status: Low Threshold
Stage: 16.14 ft
Flow: 0.0292 kcfs
Forecast
Forecast not available for this location.
| Time | Stage (ft) | Flow (kcfs) |
|---|---|---|
| 6:45 PM 12/15 | 16.14 | 0.0292 |
| 6:30 PM 12/15 | 16.14 | 0.0292 |
| 6:15 PM 12/15 | 16.14 | 0.0292 |
| 6:00 PM 12/15 | 16.14 | 0.0292 |
| 5:45 PM 12/15 | 16.14 | 0.0292 |
| 5:30 PM 12/15 | 16.14 | 0.0292 |
| 5:15 PM 12/15 | 16.15 | 0.0295 |
| 5:00 PM 12/15 | 16.15 | 0.0295 |
| 4:45 PM 12/15 | 16.15 | 0.0295 |
| 4:30 PM 12/15 | 16.15 | 0.0295 |
| 4:15 PM 12/15 | 16.15 | 0.0295 |
| 4:00 PM 12/15 | 16.15 | 0.0295 |
| 3:45 PM 12/15 | 16.15 | 0.0295 |
| 3:30 PM 12/15 | 16.15 | 0.0295 |
| 3:15 PM 12/15 | 16.15 | 0.0295 |
| 3:00 PM 12/15 | 16.15 | 0.0295 |
| 2:45 PM 12/15 | 16.15 | 0.0295 |
| 2:30 PM 12/15 | 16.15 | 0.0295 |
| 2:15 PM 12/15 | 16.15 | 0.0295 |
| 2:00 PM 12/15 | 16.15 | 0.0295 |
| 1:45 PM 12/15 | 16.15 | 0.0295 |
| 1:30 PM 12/15 | 16.15 | 0.0295 |
| 1:15 PM 12/15 | 16.15 | 0.0295 |
| 1:00 PM 12/15 | 16.15 | 0.0295 |
| 12:45 PM 12/15 | 16.15 | 0.0295 |
| 12:30 PM 12/15 | 16.15 | 0.0295 |
| 12:15 PM 12/15 | 16.15 | 0.0295 |
| 12:00 PM 12/15 | 16.15 | 0.0295 |
| 11:45 AM 12/15 | 16.15 | 0.0295 |
| 11:30 AM 12/15 | 16.15 | 0.0295 |
25.5' -
Water has flooded some hunting camps near the river and may be over Cabbage Grove Road. Water has covered portions of CR 14 near the end of the road in the Econfina River Resort. In the resort area, water is under elevated structures and requires RV removal to higher elevations. Fish and hunting camp structures that are not elevated near the river will flood.
24.5' -
Water has begun to cross secondary graded roads around CR655 and is flooding the Wayside Park and boat ramp adjacent to Highway 98. Highway 98 is not affected.
| Date | Stage (ft) |
|---|---|
| Sep 17, 1957 | 26.46 |
| Apr 7, 1973 | 26.05 |
| Aug 19, 1994 | 25.71 |
| Mar 10, 2003 | 25.55 |
| Apr 11, 1984 | 25.42 |
| Sep 17, 1964 | 25.27 |
| Feb 11, 1986 | 25.24 |
| Feb 24, 1998 | 25.24 |
| Oct 9, 1996 | 25.19 |
| Mar 6, 1991 | 25.1 |
| Apr 1, 1987 | 25.04 |
| Dec 19, 2023 | 25.01 |
| Dec 16, 2018 | 24.96 |
| Jul 24, 2013 | 24.94 |
| Apr 16, 1983 | 24.94 |
| Dec 16, 1976 | 24.94 |
| Apr 8, 2005 | 24.86 |
| Mar 20, 2014 | 24.79 |
| Jan 10, 2024 | 24.58 |
| Dec 5, 2018 | 24.42 |
Data provided by the National Weather Service.