« Back to Madison County Rivers
Ochlockonee River near Thomasville (US 84)
Critical Stages
9' - Action
15' - Flood
22' - Moderate
25' - Major
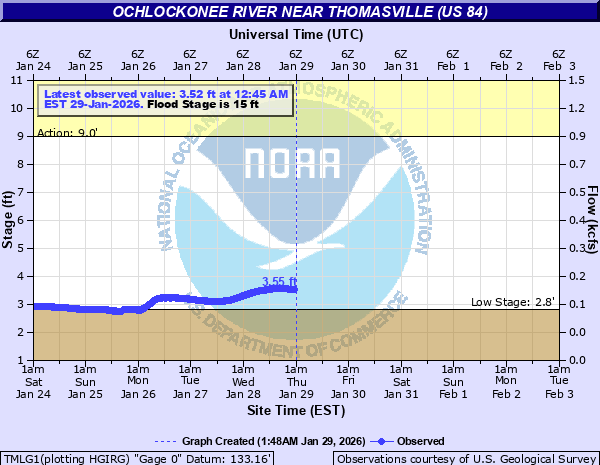
Latest Observation
Updated: 6:45 PM EST 12/15/25
Status: Low Threshold
Stage: 2.55 ft
Flow: 0.0635 kcfs
Forecast
Forecast not available for this location.
| Time | Stage (ft) | Flow (kcfs) |
|---|---|---|
| 6:45 PM 12/15 | 2.55 | 0.0635 |
| 6:30 PM 12/15 | 2.55 | 0.0635 |
| 6:15 PM 12/15 | 2.55 | 0.0635 |
| 6:00 PM 12/15 | 2.55 | 0.0635 |
| 5:45 PM 12/15 | 2.55 | 0.0635 |
| 5:30 PM 12/15 | 2.55 | 0.0635 |
| 5:15 PM 12/15 | 2.55 | 0.0635 |
| 5:00 PM 12/15 | 2.56 | 0.064 |
| 4:45 PM 12/15 | 2.56 | 0.064 |
| 4:30 PM 12/15 | 2.56 | 0.064 |
| 4:15 PM 12/15 | 2.56 | 0.064 |
| 4:00 PM 12/15 | 2.56 | 0.064 |
| 3:45 PM 12/15 | 2.56 | 0.064 |
| 3:30 PM 12/15 | 2.56 | 0.064 |
| 3:15 PM 12/15 | 2.56 | 0.064 |
| 3:00 PM 12/15 | 2.57 | 0.0645 |
| 2:45 PM 12/15 | 2.57 | 0.0645 |
| 2:30 PM 12/15 | 2.56 | 0.064 |
| 2:15 PM 12/15 | 2.56 | 0.064 |
| 2:00 PM 12/15 | 2.57 | 0.0645 |
| 1:45 PM 12/15 | 2.57 | 0.0645 |
| 1:30 PM 12/15 | 2.57 | 0.0645 |
| 1:15 PM 12/15 | 2.57 | 0.0645 |
| 1:00 PM 12/15 | 2.57 | 0.0645 |
| 12:45 PM 12/15 | 2.57 | 0.0645 |
| 12:30 PM 12/15 | 2.57 | 0.0645 |
| 12:15 PM 12/15 | 2.57 | 0.0645 |
| 12:00 PM 12/15 | 2.57 | 0.0645 |
| 11:45 AM 12/15 | 2.57 | 0.0645 |
| 11:30 AM 12/15 | 2.58 | 0.065 |
31' -
In Thomas County, water overtops the US-84 bridge. The southbound approach to the GA-3 bridge floods at this level.
30' -
In Thomas County, water overtops the US-19 bridge.
29' -
In Thomas County, water reaches the road surface of US-19 on the south side of the river. In Grady County, the GA-93 bridge is overtopped at this level.
28' -
In Thomas County, US-84 is flooded on the east side of the bridge and the water surface is near the road deck of the bridge. Water reaches the base of the GA-3 bridge on the north side of the river. The GA-202 bridge is overtopped at this level.
27' -
In Thomas County, water begins to flood road deck of the GA-202 bridge south of Lake Riverside. Water begins to flood the median of US-84 near the river and approach the road surface of the highway. In Grady County, water reaches the road surface of GA-93.
26' -
Water reaches the base of the US-19 bridge in Thomas County. The road is subject to closure above this level.
25' -
In Thomas County, water reaches the base of the US-84 bridge and the GA-202 bridge near Lake Riverside. These roads are subject to closure above this level. Water enters homes at the end of Flamingo Road. In Grady County, water will rise to the base of the GA-93 and Hadley Ferry bridges. These roads are subject to closure above this level.
24.5' -
Water will begin to flood the approaches to the GA-202 bridge near Lake Riverside.
23' -
Water begins to approach homes at the end of Flamingo Road in Thomas County. In Grady County, several structures at Dickie Ferry not elevated experience significant flooding.
22' -
In Grady County, Lewis Land near the river is completely inaccessible. Homes east of GA-93 near the river have water in their backyard. At Dickey Ferry, water floods structures not elevated near the river.
21' -
Egg and Butter Road North in Thomas County begins to flood about 1 mile south of Dusty Trail.
18' -
Access to structures at the end of Lewis Land in Grady County becomes restricted above this level. At Dickey Ferry, water begins to approach homes near the river.
15' -
Multiple access roads to boat ramps throughout the basin are flooded. Widespread flooding of wooded bottomland and adjacent farmland occurs.
12' -
Water overflows into wooded bottomlands along the river. Water approaches the top of the boat ramp south of US-19 in Thomas County.
9' -
Water floods the boat ramp beneath SR-93 in Grady County.
| Date | Stage (ft) |
|---|---|
| Apr 2, 1948 | 29.1 |
| Apr 3, 2009 | 23.83 |
| Mar 8, 1984 | 22.8 |
| Mar 30, 1991 | 22.5 |
| Feb 27, 2013 | 22.12 |
| Feb 12, 1986 | 21.997 |
| Oct 4, 1994 | 21.6 |
| Apr 17, 1961 | 20.8 |
| Apr 12, 1975 | 20.7 |
| Dec 25, 2014 | 20.52 |
| Dec 5, 1964 | 20.4 |
| Apr 3, 2016 | 19.92 |
| Mar 30, 2009 | 19.89 |
| Feb 24, 2008 | 19.36 |
| Mar 7, 1959 | 19.3 |
| May 3, 1964 | 18.8 |
| Apr 4, 1960 | 18 |
| Feb 1, 1991 | 17.7 |
| Dec 4, 2018 | 17.45 |
| Aug 19, 2013 | 17.4 |
Data provided by the National Weather Service.