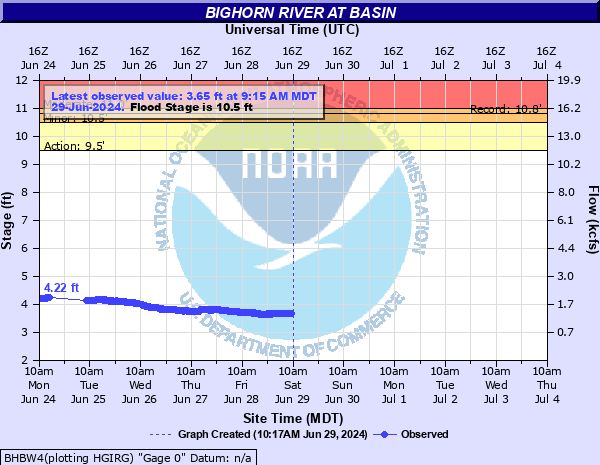
Bighorn River at Basin
Critical Stages
9.5' - Action
10.5' - Flood
11' - Moderate
13' - Major
Latest Observation
Updated: 9:15 AM MST 12/16/25
Status: No Flooding
Stage: 3.41 ft
Flow: 1 kcfs
Forecast
Forecast not available for this location.
| Time | Stage (ft) | Flow (kcfs) |
|---|---|---|
| 9:15 AM 12/16 | 3.41 | 1 |
| 9:00 AM 12/16 | 3.41 | 1 |
| 8:45 AM 12/16 | 3.41 | 1 |
| 8:30 AM 12/16 | 3.42 | 1.01 |
| 8:15 AM 12/16 | 3.41 | 1 |
| 8:00 AM 12/16 | 3.41 | 1 |
| 7:45 AM 12/16 | 3.41 | 1 |
| 7:30 AM 12/16 | 3.41 | 1 |
| 7:15 AM 12/16 | 3.41 | 1 |
| 7:00 AM 12/16 | 3.41 | 1 |
| 6:45 AM 12/16 | 3.41 | 1 |
| 6:30 AM 12/16 | 3.41 | 1 |
| 6:15 AM 12/16 | 3.41 | 1 |
| 6:00 AM 12/16 | 3.41 | 1 |
| 5:45 AM 12/16 | 3.42 | 1.01 |
| 5:30 AM 12/16 | 3.41 | 1 |
| 5:15 AM 12/16 | 3.42 | 1.01 |
| 5:00 AM 12/16 | 3.42 | 1.01 |
| 4:45 AM 12/16 | 3.42 | 1.01 |
| 4:30 AM 12/16 | 3.42 | 1.01 |
| 4:15 AM 12/16 | 3.42 | 1.01 |
| 4:00 AM 12/16 | 3.42 | 1.01 |
| 3:45 AM 12/16 | 3.42 | 1.01 |
| 3:30 AM 12/16 | 3.41 | 1 |
| 3:15 AM 12/16 | 3.41 | 1 |
| 3:00 AM 12/16 | 3.42 | 1.01 |
| 2:45 AM 12/16 | 3.41 | 1 |
| 2:30 AM 12/16 | 3.41 | 1 |
| 2:15 AM 12/16 | 3.42 | 1.01 |
| 2:00 AM 12/16 | 3.42 | 1.01 |
11' -
Extensive major agricultural flooding upstream and downstream of Basin. Low lying areas along county road just east of bridge may be under water. Water begins to totally inundate boat ramp and adjacent house near boat ramp in Basin.
10.8' -
Record stage---(6/11/2011)
10.5' -
Flood stage. Widespread major agricultural flooding upstream and downstream of Basin. Water begins to encroach boat ramp and adjacent house near boat ramp in Basin.
10.49' -
Record flow---19,500 cfs (6/7/1991).
10' -
Moderate to major agricultural flooding intensifies and becomes more widespread upstream and downstream of Basin.
9.5' -
Bankfull stage. Minor agricultural flooding continues to expand upstream and downstream of Basin.
9' -
Minor agricultural flooding begins upstream and downstream of Basin.
| Date | Stage (ft) |
|---|---|
| Jun 11, 2011 | 10.8 |
| Jun 7, 1991 | 10.49 |
| Jun 15, 1997 | 10 |
| May 29, 2019 | 9.73 |
| Jun 17, 2010 | 9.72 |
| Oct 4, 2016 | 9.65 |
| Jun 16, 1995 | 9.64 |
| Jun 12, 2015 | 9.51 |
| Dec 15, 2011 | 9.48 |
| Jun 13, 2017 | 9.46 |
| Jun 8, 2018 | 9.39 |
| Jun 9, 1999 | 8.93 |
| Oct 7, 2011 | 8.82 |
| May 11, 2005 | 8.72 |
| Jun 9, 1986 | 8.54 |
| Jun 22, 2009 | 8.22 |
| May 23, 2008 | 8.18 |
| Jun 9, 1987 | 7.87 |
| Mar 7, 2014 | 7.82 |
| May 22, 2016 | 7.76 |
Data provided by the National Weather Service.