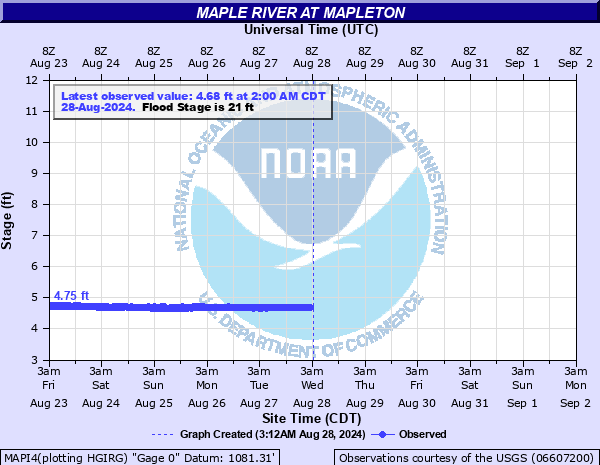
Maple River at Mapleton
Critical Stages
19' - Action
21' - Flood
22' - Moderate
23' - Major
Latest Observation
Updated: 8:00 PM CST 12/15/25
Status: No Flooding
Stage: 6.26 ft
Flow: 0.633 kcfs
Forecast
Forecast not available for this location.
| Time | Stage (ft) | Flow (kcfs) |
|---|---|---|
| 9:00 PM 12/15 | 6.2 | 0.609 |
| 8:45 PM 12/15 | 6.21 | 0.613 |
| 8:30 PM 12/15 | 6.22 | 0.617 |
| 8:15 PM 12/15 | 6.24 | 0.625 |
| 8:00 PM 12/15 | 6.26 | 0.633 |
| 7:45 PM 12/15 | 6.27 | 0.637 |
| 7:30 PM 12/15 | 6.29 | 0.645 |
| 7:15 PM 12/15 | 6.31 | 0.653 |
| 7:00 PM 12/15 | 6.33 | 0.661 |
| 6:45 PM 12/15 | 6.34 | 0.665 |
| 6:30 PM 12/15 | 6.36 | 0.673 |
| 6:15 PM 12/15 | 6.37 | 0.677 |
| 6:00 PM 12/15 | 6.39 | 0.685 |
| 5:45 PM 12/15 | 6.4 | 0.689 |
| 5:30 PM 12/15 | 6.41 | 0.693 |
| 5:15 PM 12/15 | 6.43 | 0.701 |
| 5:00 PM 12/15 | 6.43 | 0.701 |
| 4:45 PM 12/15 | 6.44 | 0.705 |
| 4:30 PM 12/15 | 6.45 | 0.709 |
| 4:15 PM 12/15 | 6.46 | 0.713 |
| 4:00 PM 12/15 | 6.47 | 0.718 |
| 3:45 PM 12/15 | 6.47 | 0.718 |
| 3:30 PM 12/15 | 6.47 | 0.718 |
| 3:15 PM 12/15 | 6.46 | 0.713 |
| 3:00 PM 12/15 | 6.45 | 0.709 |
| 2:45 PM 12/15 | 6.45 | 0.709 |
| 2:30 PM 12/15 | 6.44 | 0.705 |
| 2:15 PM 12/15 | 6.44 | 0.705 |
| 2:00 PM 12/15 | 6.44 | 0.705 |
| 1:45 PM 12/15 | 6.44 | 0.705 |
31.5' -
Though unlikely to occur, water reaches the bottom of the Highway 175 bridge at this level.
27' -
Widespread flooding envelopes the reach from just north of the airport downstream to the southwest of Mapleton. A levee protects the town of Mapleton.
24' -
Highway 175 just north of Mapleton as well as the airport experience much more widespread flooding.
22' -
Water affects Highway 175 near the airport just northwest of town.
21' -
Water begins to flow over the airstrip ramp at the city airport. Farmland, low lying roads, and the airport are generally the only areas affected.
| Date | Stage (ft) |
|---|---|
| May 31, 1959 | 24.7 |
| Mar 14, 2019 | 23.6 |
| Mar 30, 1960 | 22.9 |
| Jun 21, 1983 | 21.84 |
| Sep 12, 1978 | 21.74 |
| Mar 28, 1962 | 21.05 |
| Jun 8, 1984 | 20.51 |
| Jun 4, 1963 | 20.5 |
| May 28, 2013 | 20.43 |
| May 25, 1964 | 20.36 |
| Feb 19, 1997 | 20.32 |
| Feb 19, 1971 | 20.17 |
| Jun 15, 1991 | 19.99 |
| Jun 21, 1996 | 19.66 |
| May 7, 2007 | 18.96 |
| Jun 17, 1990 | 18.76 |
| Mar 20, 1979 | 18.76 |
| Apr 27, 1975 | 18.17 |
| Jun 9, 1967 | 17.98 |
| Jun 17, 2004 | 17.91 |
Data provided by the National Weather Service.