Chattahoochee River near Cornelia
Critical Stages
11' - Action
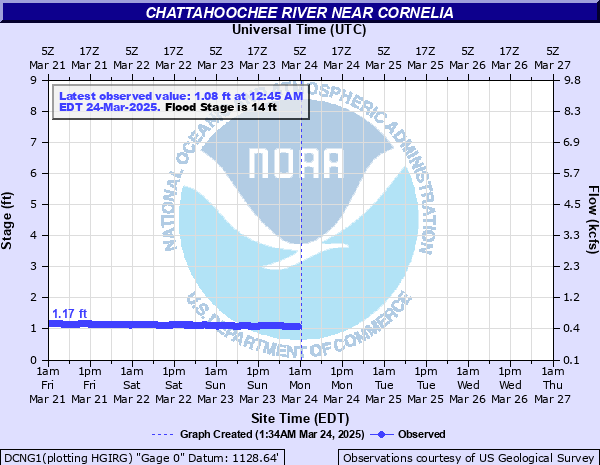
14' - Flood
18' - Moderate
21' - Major
Latest Observation
Updated: 1:45 AM EST 12/5/25
Status: No Flooding
Stage: 0.83 ft
Flow: 0.355 kcfs
Forecast
Forecast not available for this location.
| Time | Stage (ft) | Flow (kcfs) |
|---|---|---|
| 1:45 AM 12/5 | 0.83 | 0.355 |
| 1:30 AM 12/5 | 0.83 | 0.355 |
| 1:15 AM 12/5 | 0.83 | 0.355 |
| 1:00 AM 12/5 | 0.82 | 0.351 |
| 12:45 AM 12/5 | 0.81 | 0.347 |
| 12:30 AM 12/5 | 0.8 | 0.343 |
| 12:15 AM 12/5 | 0.79 | 0.339 |
| 12:00 AM 12/5 | 0.79 | 0.339 |
| 11:45 PM 12/4 | 0.78 | 0.335 |
| 11:30 PM 12/4 | 0.78 | 0.335 |
| 11:15 PM 12/4 | 0.78 | 0.335 |
| 11:00 PM 12/4 | 0.78 | 0.335 |
| 10:45 PM 12/4 | 0.78 | 0.335 |
| 10:30 PM 12/4 | 0.78 | 0.335 |
| 10:15 PM 12/4 | 0.78 | 0.335 |
| 10:00 PM 12/4 | 0.78 | 0.335 |
| 9:45 PM 12/4 | 0.78 | 0.335 |
| 9:30 PM 12/4 | 0.78 | 0.335 |
| 9:15 PM 12/4 | 0.78 | 0.335 |
| 9:00 PM 12/4 | 0.78 | 0.335 |
| 8:45 PM 12/4 | 0.78 | 0.335 |
| 8:30 PM 12/4 | 0.78 | 0.335 |
| 8:15 PM 12/4 | 0.78 | 0.335 |
| 8:00 PM 12/4 | 0.78 | 0.335 |
| 7:45 PM 12/4 | 0.78 | 0.335 |
| 7:30 PM 12/4 | 0.78 | 0.335 |
| 7:15 PM 12/4 | 0.79 | 0.339 |
| 7:00 PM 12/4 | 0.79 | 0.339 |
| 6:45 PM 12/4 | 0.79 | 0.339 |
| 6:30 PM 12/4 | 0.79 | 0.339 |
21' -
Major Flooding begins upstream and downstream from the gage on Duncan Bridge Road. Significant flooding will be occurring, and ater may be 5 to 7 feet deep along the right bank, and will be 1 to 3 feet deep in the Wildwood Outfitters building.
20' -
Moderate Flooding expands upstream and downstream from the gage on Duncan Bridge Road. Water may be 3 to 5 feet deep along the right bank, and will begin to enter the Wildwood Outfitters building.
18' -
Moderate Flood Stage is reached with additional flooding along the river upstream and downstream from the gage on Duncan Bridge Road. Water may be 1 to 3 feet deep on the right bank, near Wildwood Outfitters, and approach the building.
14' -
Flood Stage is reached with minor flooding along the river upstream and downstream from the gage on Duncan Bridge Road.
11' -
Bankfull conditions are reached upstream and downstream from the gage on Duncan Bridge Road.
| Date | Stage (ft) |
|---|---|
| Oct 11, 2020 | 20.63 |
| Mar 12, 1963 | 20.55 |
| May 28, 1973 | 20.3 |
| Aug 23, 1967 | 18.83 |
| May 29, 1976 | 17.95 |
| Jan 27, 1996 | 16.68 |
| Dec 28, 2018 | 15.53 |
| Feb 6, 2020 | 14.29 |
| Jan 9, 2024 | 14.22 |
Data provided by the National Weather Service.