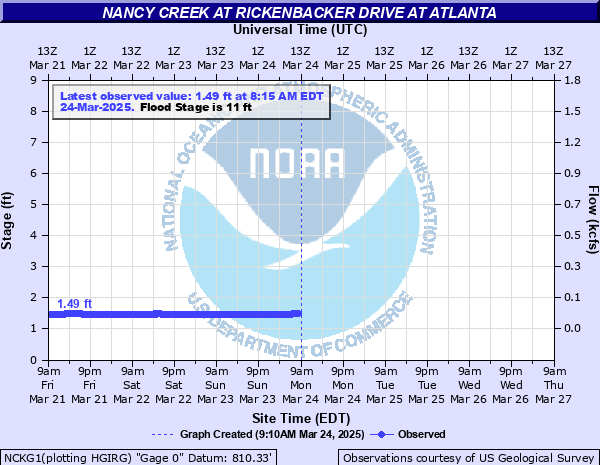
Nancy Creek at Rickenbacker Drive at Atlanta
Critical Stages
9' - Action
11' - Flood
12' - Moderate
13' - Major
Latest Observation
Updated: 1:15 AM EST 12/5/25
Status: No Flooding
Stage: 1.54 ft
Flow: 0.0798 kcfs
Forecast
Forecast not available for this location.
| Time | Stage (ft) | Flow (kcfs) |
|---|---|---|
| 1:15 AM 12/5 | 1.54 | 0.0798 |
| 1:00 AM 12/5 | 1.5 | 0.0734 |
| 12:45 AM 12/5 | 1.47 | 0.0688 |
| 12:30 AM 12/5 | 1.45 | 0.0659 |
| 12:15 AM 12/5 | 1.42 | 0.0617 |
| 12:00 AM 12/5 | 1.41 | 0.0603 |
| 11:45 PM 12/4 | 1.39 | 0.0577 |
| 11:30 PM 12/4 | 1.39 | 0.0577 |
| 11:15 PM 12/4 | 1.38 | 0.0563 |
| 11:00 PM 12/4 | 1.37 | 0.055 |
| 10:45 PM 12/4 | 1.35 | 0.0525 |
| 10:30 PM 12/4 | 1.34 | 0.0513 |
| 10:15 PM 12/4 | 1.33 | 0.0501 |
| 10:00 PM 12/4 | 1.33 | 0.0501 |
| 9:45 PM 12/4 | 1.33 | 0.0501 |
| 9:30 PM 12/4 | 1.33 | 0.0501 |
| 9:15 PM 12/4 | 1.33 | 0.0501 |
| 9:00 PM 12/4 | 1.33 | 0.0501 |
| 8:45 PM 12/4 | 1.33 | 0.0501 |
| 8:30 PM 12/4 | 1.33 | 0.0501 |
| 8:15 PM 12/4 | 1.33 | 0.0501 |
| 8:00 PM 12/4 | 1.33 | 0.0501 |
| 7:45 PM 12/4 | 1.33 | 0.0501 |
| 7:30 PM 12/4 | 1.33 | 0.0501 |
| 7:15 PM 12/4 | 1.33 | 0.0501 |
| 7:00 PM 12/4 | 1.33 | 0.0501 |
| 6:45 PM 12/4 | 1.33 | 0.0501 |
| 6:30 PM 12/4 | 1.33 | 0.0501 |
| 6:15 PM 12/4 | 1.33 | 0.0501 |
| 6:00 PM 12/4 | 1.33 | 0.0501 |
16' -
Record flooding occurs with widespread inundation of residential property...around 50 homes and some roads near the creek. Extensive flood damage occurs to homes on East Powder Horn Road and Hitching Post Trail upstream...along Rickenbacker Way near the gage on Rickenbacker Drive...and near Fairfield Drive downstream. The bridge at Rickenbacker Drive forms an obstacle and acts like a dam causing some backwater and erosion eddies to the sides of the bridge. County officials will have the bridge closed.
15' -
Near record flooding occurs with widespread inundation of residential property...around 50 homes and some roads near the creek. This includes homes on East Powder Horn Road and Hitching Post Trail upstream...along Rickenbacker Way near the gage on Rickenbacker Drive...and near Fairfield Drive downstream. The bridge at Rickenbacker Drive forms an obstacle and acts like a dam causing some backwater and erosion eddies to the sides of the bridge. County officials will have the bridge closed.
14' -
Major flooding continues with widespread inundation of residential property and around 35 homes upstream and downstream from the gage on Rickenbacker Drive. The water will be several feet deep in the crawl spaces and walkout basements of homes on East Powder Horn Road and Hitching Post Trail upstream...along Rickenbacker Way near the gage...and the out buildings on Fairfield Drive downstream. The water reaches the bottom of the bridge at Rickenbacker Drive and county officials will likely close it.
13' -
Major flooding begins with widespread flooding of residential property and around 25 homes upstream and downstream from the gage on Rickenbacker Drive. The water will be a few feet deep in the crawl spaces and walkout basements of homes on East Powder Horn Road and Hitching Post Trail around 1.5 miles upstream...along Rickenbacker Way near the gage...and the out buildings on Fairfield Drive around 2 miles downstream.
12' -
Moderate flooding occurs. Widespread flooding of residential yards and property occurs upstream and downstream from the gage on Rickenbacker Drive. The water will begin to enter crawl spaces and walkout basements of homes on East Powder Horn Road and Hitching Post Trail around 1.5 miles upstream...along Rickenbacker Way near the gage...and out buildings on Fairfield Drive around 2 miles downstream.
11' -
Flood Stage is reached. Minor flooding of residential yards occurs upstream and downstream from the gage on Rickenbacker Drive. This includes homes on East Powder Horn Road and Hitching Post Trail around 1.5 miles upstream...along Rickenbacker Way near the gage...and Fairfield Drive around 2 miles downstream.
9' -
Bankfull conditions are reached upstream and downstream from the gage on Rickenbacker Drive. Water begins to flow into low areas of the flood plain.
| Date | Stage (ft) |
|---|---|
| Dec 1, 1973 | 15.5 |
| Sep 17, 2004 | 15.26 |
| Jun 5, 1973 | 14.84 |
| Sep 22, 2009 | 14.69 |
| Sep 27, 2024 | 14.31 |
| May 3, 2010 | 13.16 |
| Feb 3, 1982 | 13.15 |
| Dec 31, 1973 | 13.05 |
| Sep 21, 2009 | 13.03 |
| Mar 17, 1990 | 12.93 |
| Apr 6, 1964 | 12.85 |
| Apr 30, 1963 | 12.55 |
| Aug 9, 2017 | 12.28 |
| Oct 11, 2020 | 12.09 |
| Apr 18, 1969 | 12.05 |
| Jun 20, 2017 | 11.86 |
| Oct 12, 2009 | 11.46 |
| Dec 28, 2018 | 11.37 |
| Sep 17, 2020 | 11.25 |
| Nov 11, 2009 | 11.09 |
Data provided by the National Weather Service.