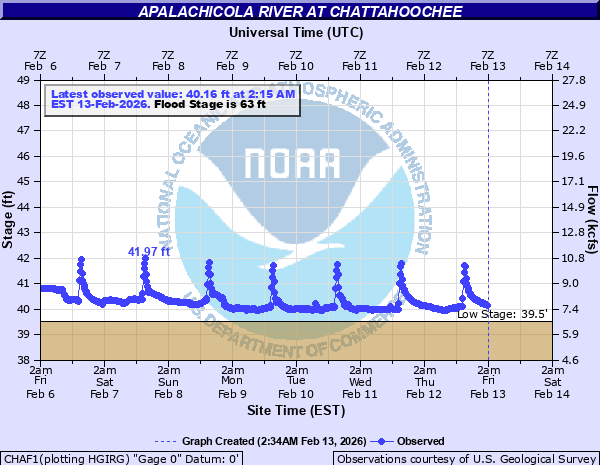
Apalachicola River at Chattahoochee
Critical Stages
56' - Action
63' - Flood
69' - Moderate
74' - Major
Latest Observation
Updated: 9:15 PM EST 12/7/25
Status: No Flooding
Stage: 42.13 ft
Flow: 11 kcfs
Forecast
Forecast not available for this location.
| Time | Stage (ft) | Flow (kcfs) |
|---|---|---|
| 9:30 PM 12/7 | 42.13 | 11 |
| 9:15 PM 12/7 | 42.13 | 11 |
| 9:00 PM 12/7 | 42.14 | 11.1 |
| 8:45 PM 12/7 | 42.14 | 11.1 |
| 8:30 PM 12/7 | 42.14 | 11.1 |
| 8:15 PM 12/7 | 42.18 | 11.1 |
| 8:00 PM 12/7 | 42.18 | 11.1 |
| 7:45 PM 12/7 | 42.18 | 11.1 |
| 7:30 PM 12/7 | 42.2 | 11.2 |
| 7:15 PM 12/7 | 42.22 | 11.2 |
| 7:00 PM 12/7 | 42.24 | 11.3 |
| 6:45 PM 12/7 | 42.24 | 11.3 |
| 6:30 PM 12/7 | 42.19 | 11.2 |
| 6:15 PM 12/7 | 42.34 | 11.4 |
| 6:00 PM 12/7 | 42.82 | 12.4 |
| 5:45 PM 12/7 | 42.74 | 12.2 |
| 5:30 PM 12/7 | 42.63 | 12 |
| 5:15 PM 12/7 | 42.49 | 11.7 |
| 5:00 PM 12/7 | 42.18 | 11.1 |
| 4:45 PM 12/7 | 42.13 | 11 |
| 4:30 PM 12/7 | 42.12 | 11 |
| 4:15 PM 12/7 | 42.13 | 11 |
| 4:00 PM 12/7 | 42.12 | 11 |
| 3:45 PM 12/7 | 42.11 | 11 |
| 3:30 PM 12/7 | 42.1 | 11 |
| 3:15 PM 12/7 | 42.1 | 11 |
| 3:00 PM 12/7 | 42.09 | 11 |
| 2:45 PM 12/7 | 42.1 | 11 |
| 2:30 PM 12/7 | 42.1 | 11 |
| 2:15 PM 12/7 | 42.1 | 11 |
No flood impact data available for this location.
| Date | Stage (ft) |
|---|---|
| Mar 12, 1998 | 76.56 |
| Jul 10, 1994 | 76.21 |
| Mar 21, 1990 | 74.04 |
| Dec 29, 2015 | 73.28 |
| Mar 9, 2020 | 71.89 |
| Apr 1, 2005 | 70.46 |
| Apr 1, 2009 | 68.85 |
| Dec 17, 2009 | 67.91 |
| Feb 23, 2020 | 67.7 |
| Mar 12, 2024 | 67.68 |
| Feb 16, 2024 | 67.38 |
| Feb 10, 2020 | 66.76 |
| Nov 29, 1992 | 65.59 |
| Mar 10, 1996 | 65.01 |
| Feb 20, 1995 | 64.98 |
| Mar 4, 1991 | 64.89 |
| Mar 23, 2001 | 64.88 |
| Apr 3, 2016 | 64.45 |
| Feb 6, 2016 | 63.63 |
| May 12, 2003 | 63.46 |
Data provided by the National Weather Service.