Little River (Midway) near Midway (SR 268)
Critical Stages
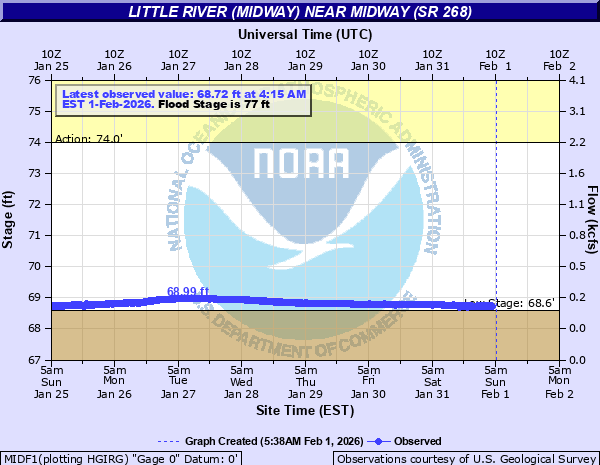
74' - Action
77' - Flood
Moderate
Major
Latest Observation
Updated: 8:15 PM EST 12/7/25
Status: No Flooding
Stage: 69.92 ft
Flow: 0.464 kcfs
Forecast
Forecast not available for this location.
| Time | Stage (ft) | Flow (kcfs) |
|---|---|---|
| 9:15 PM 12/7 | 69.95 | 0.471 |
| 9:00 PM 12/7 | 69.94 | 0.468 |
| 8:45 PM 12/7 | 69.94 | 0.468 |
| 8:30 PM 12/7 | 69.93 | 0.466 |
| 8:15 PM 12/7 | 69.92 | 0.464 |
| 8:00 PM 12/7 | 69.91 | 0.461 |
| 7:45 PM 12/7 | 69.91 | 0.461 |
| 7:30 PM 12/7 | 69.9 | 0.459 |
| 7:15 PM 12/7 | 69.89 | 0.456 |
| 7:00 PM 12/7 | 69.88 | 0.454 |
| 6:45 PM 12/7 | 69.87 | 0.451 |
| 6:30 PM 12/7 | 69.87 | 0.451 |
| 6:15 PM 12/7 | 69.85 | 0.446 |
| 6:00 PM 12/7 | 69.85 | 0.446 |
| 5:45 PM 12/7 | 69.84 | 0.444 |
| 5:30 PM 12/7 | 69.83 | 0.441 |
| 5:15 PM 12/7 | 69.82 | 0.439 |
| 5:00 PM 12/7 | 69.81 | 0.436 |
| 4:45 PM 12/7 | 69.81 | 0.436 |
| 4:30 PM 12/7 | 69.79 | 0.432 |
| 4:15 PM 12/7 | 69.78 | 0.429 |
| 4:00 PM 12/7 | 69.77 | 0.427 |
| 3:45 PM 12/7 | 69.75 | 0.422 |
| 3:30 PM 12/7 | 69.74 | 0.419 |
| 3:15 PM 12/7 | 69.73 | 0.417 |
| 3:00 PM 12/7 | 69.72 | 0.415 |
| 2:45 PM 12/7 | 69.71 | 0.412 |
| 2:30 PM 12/7 | 69.7 | 0.41 |
| 2:15 PM 12/7 | 69.69 | 0.407 |
| 2:00 PM 12/7 | 69.69 | 0.407 |
77' -
The river begins to flood into wooded bottomlands along the river.
| Date | Stage (ft) |
|---|---|
| Sep 22, 1969 | 86.25 |
| Oct 3, 1994 | 85.12 |
| Aug 24, 2008 | 83.52 |
| Dec 5, 1964 | 83.27 |
| Mar 4, 1991 | 81.7 |
| Apr 3, 2009 | 81.48 |
| Dec 3, 2018 | 81.04 |
| Sep 30, 1998 | 80.68 |
| Sep 17, 2020 | 80.54 |
| Apr 3, 2016 | 80.37 |
| Dec 24, 2014 | 80.29 |
| Apr 5, 1973 | 79.77 |
| Feb 11, 1986 | 79.65 |
| Aug 17, 1994 | 79.41 |
| Jan 23, 2017 | 78.94 |
| Mar 2, 1966 | 78.88 |
| Nov 29, 1976 | 78.31 |
| May 5, 2010 | 78.25 |
| Apr 11, 1975 | 78.19 |
| Feb 20, 1988 | 77.87 |
Data provided by the National Weather Service.