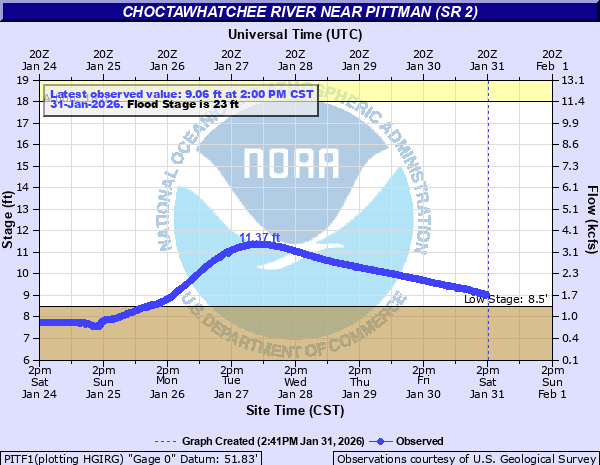
Choctawhatchee River near Pittman (SR 2)
Critical Stages
18' - Action
23' - Flood
26' - Moderate
33.5' - Major
Latest Observation
Updated: 8:00 PM CST 12/7/25
Status: No Flooding
Stage: 10.76 ft
Flow: 2.93 kcfs
Forecast
Forecast not available for this location.
| Time | Stage (ft) | Flow (kcfs) |
|---|---|---|
| 8:00 PM 12/7 | 10.76 | 2.93 |
| 7:45 PM 12/7 | 10.77 | 2.94 |
| 7:30 PM 12/7 | 10.77 | 2.94 |
| 7:15 PM 12/7 | 10.78 | 2.95 |
| 7:00 PM 12/7 | 10.78 | 2.95 |
| 6:45 PM 12/7 | 10.78 | 2.95 |
| 6:30 PM 12/7 | 10.79 | 2.96 |
| 6:15 PM 12/7 | 10.8 | 2.96 |
| 6:00 PM 12/7 | 10.8 | 2.96 |
| 5:45 PM 12/7 | 10.8 | 2.96 |
| 5:30 PM 12/7 | 10.81 | 2.97 |
| 5:15 PM 12/7 | 10.82 | 2.98 |
| 5:00 PM 12/7 | 10.82 | 2.98 |
| 4:45 PM 12/7 | 10.83 | 2.99 |
| 4:30 PM 12/7 | 10.83 | 2.99 |
| 4:15 PM 12/7 | 10.83 | 2.99 |
| 4:00 PM 12/7 | 10.84 | 3 |
| 3:45 PM 12/7 | 10.84 | 3 |
| 3:30 PM 12/7 | 10.85 | 3.01 |
| 3:15 PM 12/7 | 10.85 | 3.01 |
| 3:00 PM 12/7 | 10.86 | 3.01 |
| 2:45 PM 12/7 | 10.86 | 3.01 |
| 2:30 PM 12/7 | 10.84 | 3 |
| 2:15 PM 12/7 | 10.87 | 3.02 |
| 2:00 PM 12/7 | 10.87 | 3.02 |
| 1:45 PM 12/7 | 10.87 | 3.02 |
| 1:30 PM 12/7 | 10.87 | 3.02 |
| 1:15 PM 12/7 | 10.88 | 3.03 |
| 1:00 PM 12/7 | 10.88 | 3.03 |
| 12:45 PM 12/7 | 10.88 | 3.03 |
43' -
Water reaches the road surface of the SR-2 bridge.
35' -
Water reaches the base of the SR-2 bridge.
33.5' -
Water begins to flood SR-2 on the west bank of the river about one half mile west of the SR-2 bridge. The road is subject to closure above this level.
28' -
Portions of CR-179 are prone to flooding above this level south of SR-2 in Holmes County.
26' -
Water begins to flood two structures on the west bank of the river about one half mile south of SR-2.
24' -
Water begins to flood the baseball field and adjacent areas along Curry Ferry Road.
23' -
The boat ramp on Choctawhatchee Lane just south of the SR-2 bridge on the east bank begins to flood.
| Date | Stage (ft) |
|---|---|
| Mar 30, 2009 | 30.54 |
| Dec 29, 2015 | 28.99 |
| Dec 18, 2009 | 28.81 |
| Jan 28, 1978 | 28.56 |
| Sep 18, 2020 | 27.58 |
| Apr 3, 2005 | 27.02 |
| Apr 20, 2014 | 26.61 |
| Apr 3, 2016 | 26.54 |
| Jan 4, 2017 | 26 |
| Jan 4, 2016 | 26 |
| Feb 13, 2013 | 25.57 |
| Feb 26, 1979 | 25.53 |
| Feb 14, 2018 | 24.75 |
| Jan 24, 2017 | 24.72 |
| Apr 11, 2014 | 24.7 |
| Mar 7, 2001 | 24.49 |
| Jul 7, 2013 | 24.19 |
| Feb 13, 1981 | 24.06 |
| Mar 12, 2024 | 23.82 |
| Feb 6, 2016 | 23.78 |
Data provided by the National Weather Service.