« Back to Marion Junction Rivers
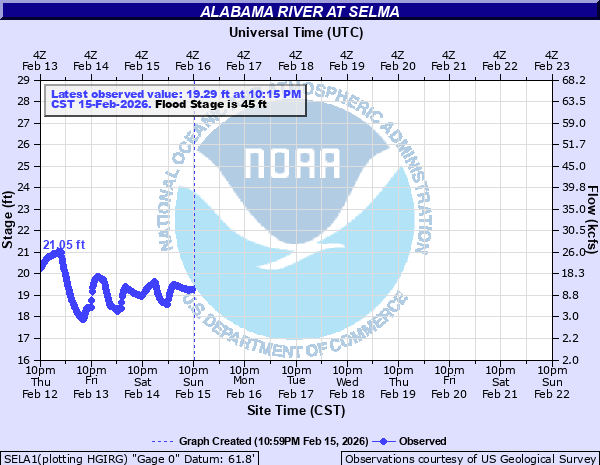
Alabama River at Selma
Critical Stages
30' - Action
45' - Flood
48' - Moderate
52' - Major
Latest Observation
Updated: 9:15 AM CST 12/6/25
Status: No Flooding
Stage: 18.92 ft
Flow: 8.24 kcfs
Forecast
Forecast not available for this location.
| Time | Stage (ft) | Flow (kcfs) |
|---|---|---|
| 9:15 AM 12/6 | 18.92 | 8.24 |
| 9:00 AM 12/6 | 18.92 | 8.24 |
| 8:45 AM 12/6 | 18.92 | 8.24 |
| 8:30 AM 12/6 | 18.92 | 8.24 |
| 8:15 AM 12/6 | 18.91 | 8.17 |
| 8:00 AM 12/6 | 18.91 | 8.17 |
| 7:45 AM 12/6 | 18.91 | 8.17 |
| 7:30 AM 12/6 | 18.91 | 8.17 |
| 7:15 AM 12/6 | 18.89 | 8.06 |
| 7:00 AM 12/6 | 18.86 | 7.95 |
| 6:45 AM 12/6 | 18.82 | 7.79 |
| 6:30 AM 12/6 | 18.79 | 7.68 |
| 6:15 AM 12/6 | 18.74 | 7.5 |
| 6:00 AM 12/6 | 18.68 | 7.28 |
| 5:45 AM 12/6 | 18.63 | 7.1 |
| 5:30 AM 12/6 | 18.61 | 7.03 |
| 5:15 AM 12/6 | 18.58 | 6.77 |
| 5:00 AM 12/6 | 18.57 | 6.66 |
| 4:45 AM 12/6 | 18.56 | 6.55 |
| 4:30 AM 12/6 | 18.55 | 6.44 |
| 4:15 AM 12/6 | 18.56 | 6.55 |
| 4:00 AM 12/6 | 18.55 | 6.44 |
| 3:45 AM 12/6 | 18.55 | 6.44 |
| 3:30 AM 12/6 | 18.56 | 6.55 |
| 3:15 AM 12/6 | 18.59 | 6.88 |
| 3:00 AM 12/6 | 18.58 | 6.77 |
| 2:45 AM 12/6 | 18.58 | 6.77 |
| 2:30 AM 12/6 | 18.56 | 6.55 |
| 2:15 AM 12/6 | 18.54 | 6.33 |
| 2:00 AM 12/6 | 18.51 | 6.02 |
58' -
Severe flooding occurs in Selma...Selmont and West Selmont.
56' -
Widespread flooding occurs in Dallas County...with many farmhouses flooded. Most of Highway 22 from the Cahaba River to the Sky Harbor Airport becomes flooded.
52' -
Most of Cahaba...as well as large portions of Selmont, West Selmont and East Selma...flood.
50' -
Low lying areas of Selmont...West Selmont and East Selmont flood. Portions of County Road 17 become inundated and water enters the yards of some residences in the Blackwell Bend area.
48' -
Flooding occurs inland to between Johnson Street and Old Montgomery Road in Selmont. Portions of Bloch Park and the Selma Country Club begin to flood.
45' -
Extensive overflow of low lying lands in the area begins. Some low roads in the area begin to flood.
30' -
Pasture lands below Selma become flooded.
| Date | Stage (ft) |
|---|---|
| Mar 1, 1961 | 57.97 |
| Apr 8, 1986 | 57 |
| Apr 8, 1886 | 57 |
| Mar 21, 1990 | 56.8 |
| Mar 19, 1929 | 56 |
| Dec 3, 1948 | 56 |
| Apr 18, 1979 | 55.02 |
| Jan 19, 1892 | 54 |
| Apr 12, 1964 | 53.39 |
| Mar 18, 1909 | 52.9 |
| Mar 25, 1943 | 52.4 |
| Dec 21, 1961 | 51.4 |
| Feb 21, 1990 | 51.27 |
| Dec 22, 1961 | 51.2 |
| Jan 1, 1933 | 50.76 |
| Mar 1, 1980 | 50.72 |
| Apr 2, 1902 | 50.7 |
| Feb 15, 1903 | 50.6 |
| Nov 20, 1929 | 50.42 |
| Mar 24, 1906 | 50.4 |
Data provided by the National Weather Service.