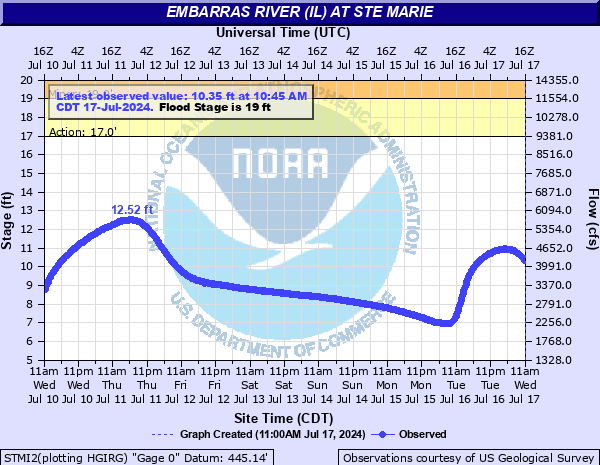
Embarras River (IL) at Ste Marie
Critical Stages
17' - Action
19' - Flood
20' - Moderate
27' - Major
Latest Observation
Updated: 6:45 AM CST 12/16/25
Status: No Flooding
Stage: 0.8 ft
Flow: 0.0699 kcfs
Forecast
Forecast not available for this location.
| Time | Stage (ft) | Flow (kcfs) |
|---|---|---|
| 6:45 AM 12/16 | 0.8 | 0.0699 |
| 6:30 AM 12/16 | 0.83 | 0.0734 |
| 6:15 AM 12/16 | 0.88 | 0.0794 |
| 6:00 AM 12/16 | 0.92 | 0.0844 |
| 5:45 AM 12/16 | 0.94 | 0.0871 |
| 5:30 AM 12/16 | 0.92 | 0.0844 |
| 5:15 AM 12/16 | 0.84 | 0.0745 |
| 5:00 AM 12/16 | 0.58 | -999 |
| 4:45 AM 12/16 | 0.6 | -999 |
| 4:30 AM 12/16 | 0.61 | 0.048 |
| 4:15 AM 12/16 | 0.62 | 0.0492 |
| 4:00 AM 12/16 | 0.63 | 0.0503 |
| 3:45 AM 12/16 | 0.64 | 0.0515 |
| 3:30 AM 12/16 | 0.65 | 0.0527 |
| 3:15 AM 12/16 | 0.66 | 0.0539 |
| 3:00 AM 12/16 | 0.67 | 0.0551 |
| 2:45 AM 12/16 | 0.68 | 0.0563 |
| 2:30 AM 12/16 | 0.7 | 0.0588 |
| 2:15 AM 12/16 | 0.7 | 0.0588 |
| 2:00 AM 12/16 | 0.71 | 0.06 |
| 1:45 AM 12/16 | 0.71 | 0.06 |
| 1:30 AM 12/16 | 0.71 | 0.06 |
| 1:15 AM 12/16 | 0.72 | 0.0611 |
| 1:00 AM 12/16 | 0.72 | 0.0611 |
| 12:45 AM 12/16 | 0.72 | 0.0611 |
| 12:30 AM 12/16 | 0.7 | 0.0588 |
| 12:15 AM 12/16 | 0.7 | 0.0588 |
| 12:00 AM 12/16 | 0.69 | 0.0575 |
| 11:45 PM 12/15 | 0.69 | 0.0575 |
| 11:30 PM 12/15 | 0.7 | 0.0588 |
27' -
Water begins to overtop Captain Pond and Ste. Marie Levees.
21' -
Water overtops a few private levees in the Ste. Marie area.
19' -
County Highway 9 floods between Ste. Marie and Willow Hill.
16' -
Flooding begins to a secondary road on the east bank near the bridge north of town.
| Date | Stage (ft) |
|---|---|
| Jun 7, 2008 | 28.06 |
| Dec 30, 2015 | 26.83 |
| Jun 30, 1957 | 26.54 |
| May 13, 2002 | 26.36 |
| May 9, 1961 | 26.08 |
| Dec 23, 1967 | 26 |
| Jan 4, 1950 | 25.95 |
| May 6, 2017 | 25.56 |
| May 30, 1927 | 25.34 |
| May 9, 1996 | 25.17 |
| Apr 1, 1938 | 25.12 |
| Jan 6, 2005 | 24.88 |
| May 20, 1943 | 24.4 |
| Feb 25, 1985 | 24.38 |
| May 1, 2017 | 24.28 |
| Apr 7, 2025 | 23.89 |
| Apr 23, 1984 | 23.78 |
| May 19, 1995 | 23.63 |
| Jan 13, 2020 | 23.62 |
| Dec 31, 1990 | 23.53 |
Data provided by the National Weather Service.