« Back to Mc Connellstown Rivers
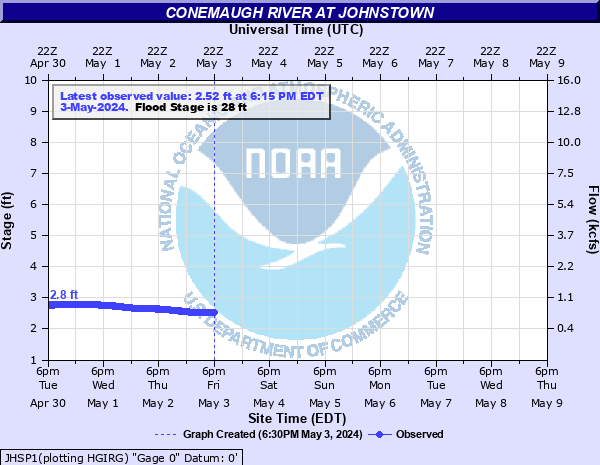
Conemaugh River at Johnstown
Critical Stages
23' - Action
28' - Flood
30' - Moderate
34' - Major
Latest Observation
Updated: 10:15 AM EST 12/8/25
Status: No Flooding
Stage: 1.61 ft
Flow: 0.247 kcfs
Forecast
Forecast not available for this location.
| Time | Stage (ft) | Flow (kcfs) |
|---|---|---|
| 11:15 AM 12/8 | 1.61 | 0.247 |
| 11:00 AM 12/8 | 1.61 | 0.247 |
| 10:45 AM 12/8 | 1.62 | 0.252 |
| 10:30 AM 12/8 | 1.61 | 0.247 |
| 10:15 AM 12/8 | 1.61 | 0.247 |
| 10:00 AM 12/8 | 1.62 | 0.252 |
| 9:45 AM 12/8 | 1.62 | 0.252 |
| 9:30 AM 12/8 | 1.62 | 0.252 |
| 9:15 AM 12/8 | 1.63 | 0.256 |
| 9:00 AM 12/8 | 1.62 | 0.252 |
| 8:45 AM 12/8 | 1.62 | 0.252 |
| 8:30 AM 12/8 | 1.62 | 0.252 |
| 8:15 AM 12/8 | 1.63 | 0.256 |
| 8:00 AM 12/8 | 1.63 | 0.256 |
| 7:45 AM 12/8 | 1.63 | 0.256 |
| 7:30 AM 12/8 | 1.63 | 0.256 |
| 7:15 AM 12/8 | 1.63 | 0.256 |
| 7:00 AM 12/8 | 1.63 | 0.256 |
| 6:45 AM 12/8 | 1.63 | 0.256 |
| 6:30 AM 12/8 | 1.63 | 0.256 |
| 6:15 AM 12/8 | 1.64 | 0.261 |
| 6:00 AM 12/8 | 1.63 | 0.256 |
| 5:45 AM 12/8 | 1.64 | 0.261 |
| 5:30 AM 12/8 | 1.64 | 0.261 |
| 5:15 AM 12/8 | 1.64 | 0.261 |
| 5:00 AM 12/8 | 1.63 | 0.256 |
| 4:45 AM 12/8 | 1.64 | 0.261 |
| 4:30 AM 12/8 | 1.64 | 0.261 |
| 4:15 AM 12/8 | 1.64 | 0.261 |
| 4:00 AM 12/8 | 1.64 | 0.261 |
41.6' -
Flood of record from 1889.
34' -
Flood waters begin to reach the Horner Street Bridge.
33.5' -
Approximate level of the FEMA 0.2 0X0P+0nnual Chance Flood level (500-year flood).
28' -
Unprotected areas in the vicinity of the river will flood.
26' -
High water levels should be monitored for contunued rises.
23.5' -
Approximate level of the FEMA 1 0X0P+0nnual Chance Flood level (100-year flood).
22.5' -
Flood waters begin to reach the Coopersdale, or Laurel Avenue Bridge.
20.5' -
Flood waters begin to reach the Fourth Avenue Bridge and the Bethlehem Steel footbridge.
19' -
Approximate level of the FEMA 2 0X0P+0nnual Chance Flood level (50-year flood).
10.5' -
Approximate level of the FEMA 10 0X0P+0nnual Chance Flood level (100-year flood).
| Date | Stage (ft) |
|---|---|
| May 31, 1889 | 41.6 |
| Mar 18, 1936 | 39 |
| Jul 20, 1977 | 34 |
| Mar 29, 1924 | 30.2 |
| Jan 19, 1996 | 25.299999237061 |
Data provided by the National Weather Service.