« Back to Mc Connellstown Rivers
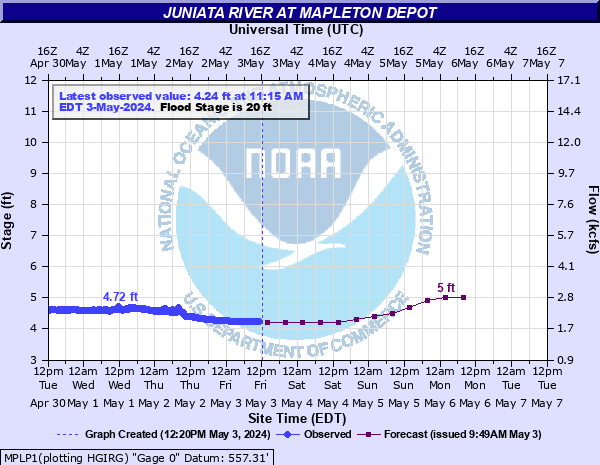
Juniata River at Mapleton Depot
Critical Stages
15' - Action
20' - Flood
24' - Moderate
26' - Major
Latest Observation
Updated: 10:15 AM EST 12/8/25
Status: No Flooding
Stage: 2.89 ft
Flow: 0.856 kcfs
Forecast
| Time | Stage (ft) | Flow (kcfs) |
|---|---|---|
| 1 PM 12/8 | 2.9 | 0.863 |
| 7 PM 12/8 | 2.9 | 0.863 |
| 1 AM 12/9 | 2.9 | 0.863 |
| 7 AM 12/9 | 2.9 | 0.863 |
| 1 PM 12/9 | 2.9 | 0.863 |
| 7 PM 12/9 | 2.9 | 0.863 |
| 1 AM 12/10 | 2.9 | 0.863 |
| 7 AM 12/10 | 2.9 | 0.863 |
| 1 PM 12/10 | 2.9 | 0.863 |
| 7 PM 12/10 | 2.9 | 0.863 |
| 1 AM 12/11 | 3.1 | 1 |
| 7 AM 12/11 | 3.3 | 1.14 |
| Time | Stage (ft) | Flow (kcfs) |
|---|---|---|
| 10:15 AM 12/8 | 2.89 | 0.856 |
| 10:00 AM 12/8 | 2.89 | 0.856 |
| 9:45 AM 12/8 | 2.89 | 0.856 |
| 9:30 AM 12/8 | 2.89 | 0.856 |
| 9:15 AM 12/8 | 2.89 | 0.856 |
| 9:00 AM 12/8 | 2.89 | 0.856 |
| 8:45 AM 12/8 | 2.9 | 0.863 |
| 8:30 AM 12/8 | 2.89 | 0.856 |
| 8:15 AM 12/8 | 2.89 | 0.856 |
| 8:00 AM 12/8 | 2.89 | 0.856 |
| 7:45 AM 12/8 | 2.89 | 0.856 |
| 7:30 AM 12/8 | 2.89 | 0.856 |
| 7:15 AM 12/8 | 2.89 | 0.856 |
| 7:02 AM 12/8 | 2.9 | 0.863 |
| 7:00 AM 12/8 | 2.9 | 0.863 |
| 6:45 AM 12/8 | 2.89 | 0.856 |
| 6:30 AM 12/8 | 2.89 | 0.856 |
| 6:15 AM 12/8 | 2.89 | 0.856 |
| 6:00 AM 12/8 | 2.89 | 0.856 |
| 5:45 AM 12/8 | 2.89 | 0.856 |
| 5:30 AM 12/8 | 2.89 | 0.856 |
| 5:15 AM 12/8 | 2.89 | 0.856 |
| 5:00 AM 12/8 | 2.89 | 0.856 |
| 4:45 AM 12/8 | 2.89 | 0.856 |
| 4:30 AM 12/8 | 2.89 | 0.856 |
| 4:15 AM 12/8 | 2.89 | 0.856 |
| 4:00 AM 12/8 | 2.89 | 0.856 |
| 3:45 AM 12/8 | 2.9 | 0.863 |
| 3:30 AM 12/8 | 2.89 | 0.856 |
| 3:15 AM 12/8 | 2.9 | 0.863 |
30' -
Widespread flooding occurs in the Mapleton area.
28' -
Numerous homes and businesses in the Mapleton area are flooded. High water inundates the approaches to the bridge connecting Mapleton with Route 22.
26' -
Many homes on the right, or south bank are affected. The approaches of the highway bridge connecting Mapleton with Route 22 are inundated.
24' -
The right, or south bank overflows. High water affects homes on the right bank near the gage. The glass plant upstream of the gage on the left bank is also flooded.
22' -
The left, or north bank overflows into low lying areas. Route 22 is threatened.
20' -
The left or north bank overflows into low lying areas.
| Date | Stage (ft) |
|---|---|
| Mar 18, 1936 | 38.2 |
| Jun 23, 1972 | 33.07 |
| Nov 25, 1950 | 26.4 |
| Sep 18, 2004 | 23.76 |
| Jan 20, 1996 | 22.47 |
| Dec 31, 1942 | 20.82 |
| Apr 3, 1970 | 20.76 |
| Feb 26, 1961 | 18.61 |
| Feb 15, 1984 | 18.33 |
| Mar 12, 1952 | 18.14 |
Data provided by the National Weather Service.