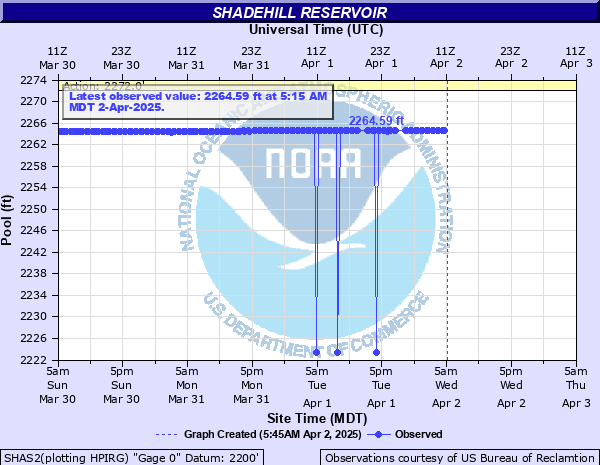
Shadehill Reservoir
Critical Stages
2272' - Action
Flood
Moderate
Major
Latest Observation
Updated: 1:15 PM MST 12/15/25
Status: No Flooding
Stage: 2267.78 ft
Flow: 0.0014 kcfs
Forecast
Forecast not available for this location.
| Time | Stage (ft) | Flow (kcfs) |
|---|---|---|
| 1:15 PM 12/15 | 2267.78 | 0.0014 |
| 1:00 PM 12/15 | 2267.78 | 0.0014 |
| 12:45 PM 12/15 | 2267.77 | 0.0014 |
| 12:30 PM 12/15 | 2267.78 | 0.0014 |
| 12:15 PM 12/15 | 2267.78 | 0.0014 |
| 12:00 PM 12/15 | 2267.78 | 0.0014 |
| 11:45 AM 12/15 | 2267.78 | 0.0014 |
| 11:30 AM 12/15 | 2267.78 | 0.0014 |
| 11:15 AM 12/15 | 2267.77 | 0.0014 |
| 11:00 AM 12/15 | 2267.78 | 0.0014 |
| 10:45 AM 12/15 | 2267.77 | 0.0014 |
| 10:30 AM 12/15 | 2267.78 | 0.0014 |
| 10:15 AM 12/15 | 2267.78 | 0.0014 |
| 10:00 AM 12/15 | 2267.78 | 0.0014 |
| 9:45 AM 12/15 | 2267.77 | 0.0014 |
| 9:30 AM 12/15 | 2267.78 | 0.0014 |
| 9:15 AM 12/15 | 2267.78 | 0.0014 |
| 9:00 AM 12/15 | 2267.78 | 0.0014 |
| 8:45 AM 12/15 | 2267.78 | 0.0014 |
| 8:30 AM 12/15 | 2267.77 | 0.0014 |
| 8:15 AM 12/15 | 2267.78 | 0.0014 |
| 8:00 AM 12/15 | 2267.77 | 0.0014 |
| 7:45 AM 12/15 | 2267.78 | 0.0014 |
| 7:30 AM 12/15 | 2267.77 | 0.0014 |
| 7:15 AM 12/15 | 2267.77 | 0.0014 |
| 7:00 AM 12/15 | 2267.77 | 0.0014 |
| 6:45 AM 12/15 | 2267.78 | 0.0014 |
| 6:30 AM 12/15 | 2267.77 | 0.0014 |
| 6:15 AM 12/15 | 2267.77 | 0.0014 |
| 6:00 AM 12/15 | 2267.77 | 0.0014 |
2318' -
Dam crest elevation.
2297.9' -
Near record flooding with similar flooding to what occurred in 1950 before the reservoir was completed.
2290.83' -
Reservoir elevation on April 17, 2009.
2280' -
Water begins to impact the road to the Shadehill Recreation Area.
2272' -
Water begins flowing into an uncontrolled outlet and is discharged downstream.
2260' -
Top of active conservation pool.
2253.4' -
Top of inactive conservation pool.
2250.8' -
Top of dead storage pool.
2220' -
Streambed elevation at dam axis.
| Date | Stage (ft) |
|---|---|
| Apr 10, 1952 | 2297.86 |
| Apr 17, 2009 | 2290.83 |
| Mar 29, 2019 | 2283.98 |
| Apr 2, 1978 | 2282.42 |
| Mar 24, 1997 | 2280.01 |
| Mar 22, 2011 | 2276.65 |
| Mar 15, 1972 | 2276.37 |
| Jun 22, 1953 | 2276.24 |
| May 15, 1995 | 2275.83 |
| May 23, 1982 | 2275.66 |
| Jul 29, 1993 | 2275.3 |
| Apr 1, 1971 | 2275.01 |
| Mar 15, 2014 | 2274.92 |
| Jun 16, 1967 | 2274.29 |
| May 29, 1996 | 2274.26 |
| May 28, 1965 | 2274.24 |
| Apr 5, 1969 | 2274.14 |
| Apr 9, 1987 | 2273.86 |
| May 11, 1986 | 2273.78 |
| Mar 19, 1994 | 2273.61 |
Data provided by the National Weather Service.