Rolling Fork River near Boston
Critical Stages
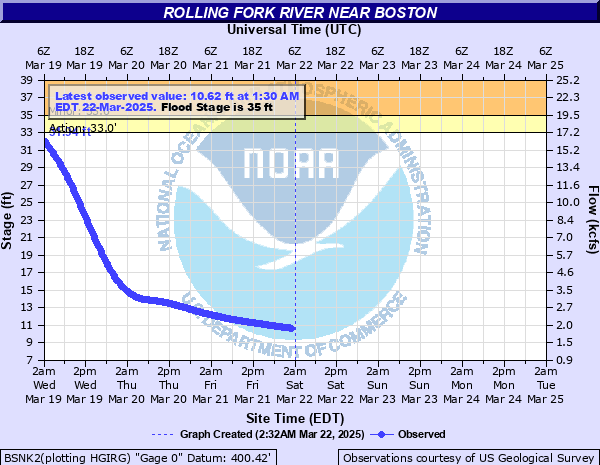
33' - Action
35' - Flood
42' - Moderate
45' - Major
Latest Observation
Updated: 2:30 PM EST 12/6/25
Status: No Flooding
Stage: 5.63 ft
Flow: 0.476 kcfs
Forecast
Forecast not available for this location.
| Time | Stage (ft) | Flow (kcfs) |
|---|---|---|
| 2:30 PM 12/6 | 5.63 | 0.476 |
| 2:15 PM 12/6 | 5.63 | 0.476 |
| 2:00 PM 12/6 | 5.63 | 0.476 |
| 1:45 PM 12/6 | 5.63 | 0.476 |
| 1:30 PM 12/6 | 5.63 | 0.476 |
| 1:15 PM 12/6 | 5.63 | 0.476 |
| 1:00 PM 12/6 | 5.63 | 0.476 |
| 12:45 PM 12/6 | 5.63 | 0.476 |
| 12:30 PM 12/6 | 5.63 | 0.476 |
| 12:15 PM 12/6 | 5.64 | 0.478 |
| 12:00 PM 12/6 | 5.63 | 0.476 |
| 11:45 AM 12/6 | 5.63 | 0.476 |
| 11:30 AM 12/6 | 5.63 | 0.476 |
| 11:15 AM 12/6 | 5.64 | 0.478 |
| 11:00 AM 12/6 | 5.64 | 0.478 |
| 10:45 AM 12/6 | 5.64 | 0.478 |
| 10:30 AM 12/6 | 5.64 | 0.478 |
| 10:15 AM 12/6 | 5.64 | 0.478 |
| 10:00 AM 12/6 | 5.64 | 0.478 |
| 9:45 AM 12/6 | 5.64 | 0.478 |
| 9:30 AM 12/6 | 5.64 | 0.478 |
| 9:15 AM 12/6 | 5.64 | 0.478 |
| 9:00 AM 12/6 | 5.64 | 0.478 |
| 8:45 AM 12/6 | 5.64 | 0.478 |
| 8:30 AM 12/6 | 5.64 | 0.478 |
| 8:15 AM 12/6 | 5.64 | 0.478 |
| 8:00 AM 12/6 | 5.64 | 0.478 |
| 7:45 AM 12/6 | 5.64 | 0.478 |
| 7:30 AM 12/6 | 5.64 | 0.478 |
| 7:15 AM 12/6 | 5.64 | 0.478 |
55' -
Water begins flowing over top of floodwall in Lebanon Junction.
54' -
Bluegrass Parkway floods cutting off Beech Fork.
53' -
Water enters Wallace Funeral Home. Water reaches second story in a few homes in Boston. Water is 8 feet deep in parts of New Haven. Travel is impossible.
52' -
Many homes in Boston flood.
51' -
Homes in Boston begin to flood.
50' -
Town of Boston is cut off as US Highways 52, 61 and 62 are flooded. Water is 3 to 6 feet deep in west and central parts of New Haven. KY 434 floods at bridge in Lebanon Junction.
49' -
Evacuations begin in Boston.
48' -
Water may cover parts of US 31E in New Haven.
45' -
Houses in low areas in Boston flood.
43' -
Floodwall begins closing in Lebanon Junction.
42' -
A few homes and trailers outside of Boston flood.
40' -
Water begins to cross low spots on some county roads. Some homes in flood plain are cutoff.
35' -
Agricultural bottomland is covered.
| Date | Stage (ft) |
|---|---|
| Jan 26, 1937 | 55.2 |
| Mar 3, 1997 | 53.22 |
| Feb 17, 1989 | 52.62 |
| Apr 7, 2025 | 52.61 |
| Dec 10, 1978 | 51.73 |
| Mar 12, 1964 | 51 |
| May 5, 2010 | 50.74 |
| Apr 17, 1972 | 49.78 |
| Apr 30, 1970 | 48.8 |
| May 9, 1984 | 48.49 |
| Feb 1, 1962 | 48.35 |
| Feb 18, 2025 | 47.8 |
| May 10, 1961 | 47.15 |
| Jan 13, 1974 | 46.7 |
| Jan 8, 1950 | 46.6 |
| Mar 3, 2021 | 46.24 |
| Mar 31, 1975 | 46.16 |
| Feb 2, 1950 | 46 |
| Feb 17, 1949 | 45.9 |
| Nov 21, 1957 | 45.8 |
Data provided by the National Weather Service.