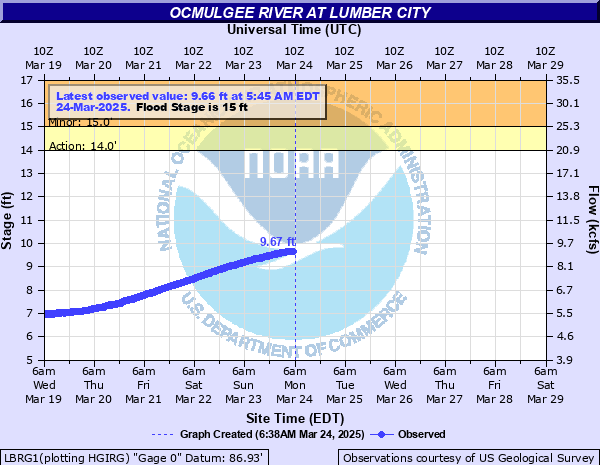
Ocmulgee River at Lumber City
Critical Stages
14' - Action
15' - Flood
18' - Moderate
23' - Major
Latest Observation
Updated: 10:45 PM EST 12/15/25
Status: No Flooding
Stage: 2.48 ft
Flow: 2.4 kcfs
Forecast
Forecast not available for this location.
| Time | Stage (ft) | Flow (kcfs) |
|---|---|---|
| 11:45 PM 12/15 | 2.48 | 2.4 |
| 11:30 PM 12/15 | 2.47 | 2.39 |
| 11:15 PM 12/15 | 2.48 | 2.4 |
| 11:00 PM 12/15 | 2.48 | 2.4 |
| 10:45 PM 12/15 | 2.48 | 2.4 |
| 10:30 PM 12/15 | 2.48 | 2.4 |
| 10:15 PM 12/15 | 2.48 | 2.4 |
| 10:00 PM 12/15 | 2.48 | 2.4 |
| 9:45 PM 12/15 | 2.49 | 2.4 |
| 9:30 PM 12/15 | 2.49 | 2.4 |
| 9:15 PM 12/15 | 2.5 | 2.41 |
| 9:00 PM 12/15 | 2.5 | 2.41 |
| 8:45 PM 12/15 | 2.51 | 2.42 |
| 8:30 PM 12/15 | 2.5 | 2.41 |
| 8:15 PM 12/15 | 2.5 | 2.41 |
| 8:00 PM 12/15 | 2.49 | 2.4 |
| 7:45 PM 12/15 | 2.51 | 2.42 |
| 7:30 PM 12/15 | 2.51 | 2.42 |
| 7:15 PM 12/15 | 2.52 | 2.42 |
| 7:00 PM 12/15 | 2.53 | 2.43 |
| 6:45 PM 12/15 | 2.52 | 2.42 |
| 6:30 PM 12/15 | 2.53 | 2.43 |
| 6:15 PM 12/15 | 2.52 | 2.42 |
| 6:00 PM 12/15 | 2.53 | 2.43 |
| 5:45 PM 12/15 | 2.53 | 2.43 |
| 5:30 PM 12/15 | 2.54 | 2.43 |
| 5:15 PM 12/15 | 2.55 | 2.44 |
| 5:00 PM 12/15 | 2.54 | 2.43 |
| 4:45 PM 12/15 | 2.54 | 2.43 |
| 4:30 PM 12/15 | 2.55 | 2.44 |
37' -
Major flooding continues. Southern Railroad Bridge flooded out.
33' -
Major flooding expands. Highway 341 bridge is flooded.
30' -
Major flooding continues. Entire town of Lumber City will be cut off and isolated by Ocmulgee River...and swollen local creeks and small streams will occur. Some businesses and homes will flood near river, and water reaches the under supports of the Highway 341 bridge.
23' -
Major flooding begins. A mobile home floods on the southside of the Highway 341 bridge.
18' -
Moderate flooding begins. Flooding of the access road to the boat ramp near the Highway 341 bridge begins.
15' -
Flood Stage is reached and minor flooding begins. Water overflows into the broad swampy flood plain. Farm fields on the right bank flood. General agriculture and timber interests are affected by the flooding. In addition, water reaches the top of the boat ramp near the Highway 341 bridge.
14' -
Bankfull conditions begin. Water begins to spread into the natural floodplain.
| Date | Stage (ft) |
|---|---|
| Jan 21, 1925 | 26.3 |
| Jul 15, 1994 | 24.59 |
| Mar 12, 1929 | 23.5 |
| Apr 16, 1936 | 22.7 |
| Dec 9, 1949 | 22.7 |
| Mar 1, 1891 | 21.6 |
| Mar 23, 1913 | 21.1 |
| Mar 16, 1998 | 20.63 |
| Mar 31, 1944 | 20.5 |
| Aug 22, 1928 | 20.3 |
| Mar 13, 1974 | 20.2 |
| Mar 13, 1971 | 20.19 |
| Jan 4, 2016 | 20.17 |
| Mar 8, 1979 | 20.1 |
| Oct 10, 1929 | 19.9 |
| Mar 25, 1975 | 19.5 |
| Mar 31, 1942 | 19.5 |
| Mar 10, 1966 | 19.4 |
| Mar 24, 1912 | 19.3 |
| Feb 28, 2020 | 19.17 |
Data provided by the National Weather Service.