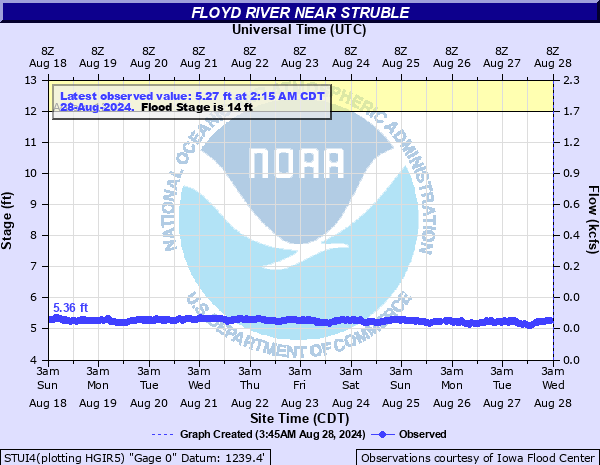
Floyd River near Struble
Critical Stages
12' - Action
14' - Flood
15' - Moderate
18' - Major
Latest Observation
Updated: 8:00 AM CST 12/16/25
Status: No Flooding
Stage: 4.55 ft
Flow: 0.0219 kcfs
Forecast
Forecast not available for this location.
| Time | Stage (ft) | Flow (kcfs) |
|---|---|---|
| 8:00 AM 12/16 | 4.55 | 0.0219 |
| 7:00 AM 12/16 | 4.58 | 0.0231 |
| 6:00 AM 12/16 | 4.57 | 0.0227 |
| 5:00 AM 12/16 | 4.58 | 0.0231 |
| 4:00 AM 12/16 | 4.59 | 0.0236 |
| 3:00 AM 12/16 | 4.56 | 0.0223 |
| 2:00 AM 12/16 | 4.55 | 0.0219 |
| 1:00 AM 12/16 | 4.56 | 0.0223 |
| 12:00 AM 12/16 | 4.53 | 0.0211 |
| 11:00 PM 12/15 | 4.51 | 0.0204 |
| 9:00 PM 12/15 | 4.52 | 0.0207 |
| 8:00 PM 12/15 | 4.5 | 0.02 |
| 7:00 PM 12/15 | 4.46 | 0.0183 |
| 6:00 PM 12/15 | 4.43 | 0.0171 |
| 5:00 PM 12/15 | 4.32 | 0.0127 |
| 4:00 PM 12/15 | 4.17 | 0.0065 |
| 3:00 PM 12/15 | 3.95 | 0 |
| 2:00 PM 12/15 | 3.9 | 0 |
| 1:00 PM 12/15 | 3.99 | 0 |
| 12:00 PM 12/15 | 4.16 | 0.0061 |
| 11:00 AM 12/15 | 4.12 | 0.0046 |
| 10:00 AM 12/15 | 4.21 | 0.0083 |
| 9:00 AM 12/15 | 4.46 | 0.0183 |
| 8:00 AM 12/15 | 4.51 | 0.0204 |
| 7:00 AM 12/15 | 4.56 | 0.0223 |
| 6:00 AM 12/15 | 4.56 | 0.0223 |
| 5:00 AM 12/15 | 4.54 | 0.0215 |
| 4:00 AM 12/15 | 4.53 | 0.0211 |
| 3:00 AM 12/15 | 4.51 | 0.0204 |
| 2:00 AM 12/15 | 4.47 | 0.0187 |
25' -
Hwy 75 may be flooded in the lowest spots and additional outbuildings and homes are in danger of flooding.
22' -
Water reaches the sensor feed-horn on the IFC gage and the bridge on 500th St is in danger of being overtopped.
20' -
The bridge on 120th St is overtopped.
18.5' -
Some outbuildings begin to flood, including a few northwest of the gage location.
17.5' -
Water reaches the bottom of the bridge on 120th St.
16' -
A couple county roads begin to flood, including the low spot on 500th St west of the bridge. A couple of stretches of the railroad between Maurice and Merrill may also flood.
15' -
Some private roads and driveways begin to flood.
14' -
A significant amount of agricultural land begins to flood.
12' -
Minor flooding of the lowest lying agricultural areas upstream of the gage begins.
| Date | Stage (ft) |
|---|---|
| Jun 22, 2024 | 18.47 |
| Mar 14, 2019 | 16.41 |
| Sep 21, 2018 | 16.24 |
| Jun 20, 1983 | 15.86 |
| Mar 4, 1994 | 15.86 |
| Jul 30, 2010 | 15.86 |
| May 27, 2013 | 15.77 |
| Mar 28, 1962 | 15.63 |
| Feb 19, 1971 | 15.5 |
| Mar 22, 1979 | 15.39 |
| Feb 9, 1966 | 15.27 |
| Feb 10, 2009 | 15.16 |
| Jun 24, 1974 | 15.03 |
| Apr 4, 1969 | 14.9 |
| Mar 13, 2007 | 14.79 |
| Mar 29, 1960 | 14.72 |
| Feb 23, 1982 | 14.63 |
| May 28, 1970 | 14.61 |
| Jun 17, 1990 | 14.57 |
| Apr 1, 1965 | 14.49 |
Data provided by the National Weather Service.