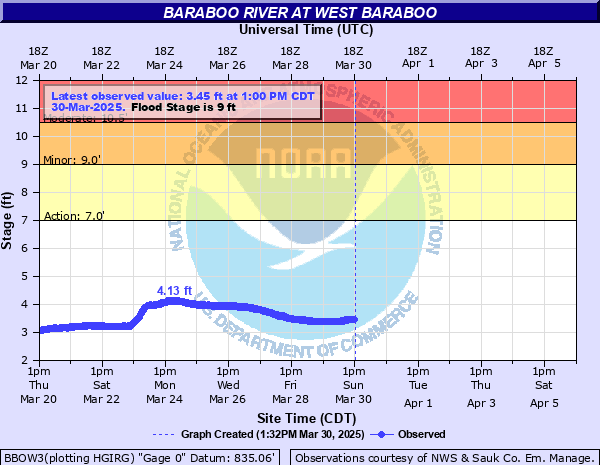
Baraboo River at West Baraboo
Critical Stages
7' - Action
9' - Flood
10.5' - Moderate
12.5' - Major
Latest Observation
Updated: 3:00 AM CST 12/7/25
Status: No Flooding
Stage: 2.67 ft
Flow: 0.219 kcfs
Forecast
Forecast not available for this location.
| Time | Stage (ft) | Flow (kcfs) |
|---|---|---|
| 3:00 AM 12/7 | 2.67 | 0.219 |
| 2:45 AM 12/7 | 2.67 | 0.219 |
| 2:30 AM 12/7 | 2.66 | 0.21 |
| 2:15 AM 12/7 | 2.65 | 0.2 |
| 2:00 AM 12/7 | 2.65 | 0.2 |
| 1:45 AM 12/7 | 2.65 | 0.2 |
| 1:30 AM 12/7 | 2.65 | 0.2 |
| 1:15 AM 12/7 | 2.64 | 0.192 |
| 1:00 AM 12/7 | 2.64 | 0.192 |
| 12:45 AM 12/7 | 2.64 | 0.192 |
| 12:30 AM 12/7 | 2.64 | 0.192 |
| 12:15 AM 12/7 | 2.63 | 0.183 |
| 12:00 AM 12/7 | 2.63 | 0.183 |
| 11:45 PM 12/6 | 2.63 | 0.183 |
| 11:30 PM 12/6 | 2.64 | 0.192 |
| 11:15 PM 12/6 | 2.64 | 0.192 |
| 11:00 PM 12/6 | 2.64 | 0.192 |
| 10:45 PM 12/6 | 2.63 | 0.183 |
| 10:30 PM 12/6 | 2.64 | 0.192 |
| 10:15 PM 12/6 | 2.63 | 0.183 |
| 10:00 PM 12/6 | 2.63 | 0.183 |
| 9:45 PM 12/6 | 2.63 | 0.183 |
| 9:30 PM 12/6 | 2.64 | 0.192 |
| 9:15 PM 12/6 | 2.63 | 0.183 |
| 9:00 PM 12/6 | 2.63 | 0.183 |
| 8:45 PM 12/6 | 2.64 | 0.192 |
| 8:30 PM 12/6 | 2.63 | 0.183 |
| 8:15 PM 12/6 | 2.63 | 0.183 |
| 8:00 PM 12/6 | 2.63 | 0.183 |
| 7:45 PM 12/6 | 2.63 | 0.183 |
13.69' -
Floodwaters are into the lower portions of Haskins Park in West Baraboo. There is widespead lowland and agricultural land flooding in the West Baraboo and Baraboo areas.
12' -
There is widespread lowland and agricultural land flooding in the Baraboo area. Floodwaters spread into the lower portions of Haskins Park in West Baraboo in the area of the gauge.
11' -
There is widespread lowland and agricultural land in the Baraboo area. Floodwaters enter the lower parts of Haskins Park in West Baraboo.
10' -
There is widespread lowland and agricultural land flooding in the Baraboo area.
9' -
Which is flood stage, there is widespread lowland flooding in the Baraboo area.
8' -
Water overspreads the lowest banks of the river in the Baraboo area.
7' -
There is minor lowland flooding in the Baraboo area.
| Date | Stage (ft) |
|---|---|
| Jun 13, 2008 | 13.69 |
| Sep 1, 2018 | 10.76 |
| Sep 7, 2018 | 10.52 |
| Jul 12, 2008 | 7.85 |
| Sep 26, 2016 | 7.67 |
| Aug 21, 2007 | 7.57 |
| Jul 22, 2017 | 7.46 |
| May 23, 2004 | 7.41 |
| Jul 15, 2010 | 7.25 |
| Jun 10, 2004 | 7.23 |
| Sep 11, 2016 | 6.52 |
| Apr 14, 2014 | 6.32 |
| Mar 15, 2007 | 6.28 |
| Mar 24, 2011 | 6.22 |
| Apr 11, 2013 | 5.86 |
| Mar 13, 2010 | 5.56 |
| Apr 11, 2008 | 5.53 |
| Apr 11, 2015 | 5.31 |
| Apr 6, 2008 | 5.26 |
| Dec 19, 2015 | 5.17 |
Data provided by the National Weather Service.