Black Earth Creek at Mazomanie
Critical Stages
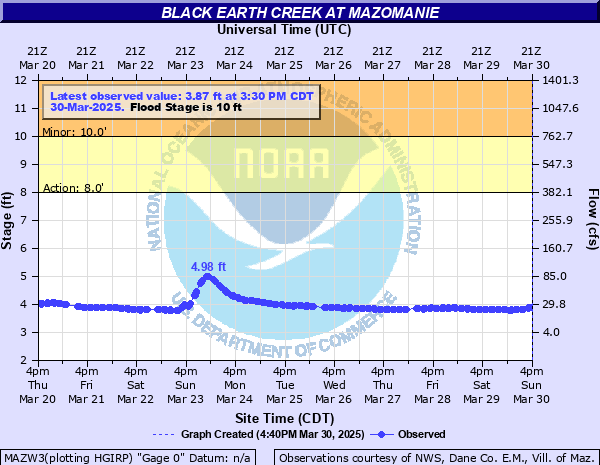
8' - Action
10' - Flood
13' - Moderate
15' - Major
Latest Observation
Updated: 2:45 AM CST 12/7/25
Status: No Flooding
Stage: 3.39 ft
Flow: 0.0108 kcfs
Forecast
Forecast not available for this location.
| Time | Stage (ft) | Flow (kcfs) |
|---|---|---|
| 2:45 AM 12/7 | 3.39 | 0.0108 |
| 2:30 AM 12/7 | 3.39 | 0.0108 |
| 2:15 AM 12/7 | 3.39 | 0.0108 |
| 2:00 AM 12/7 | 3.39 | 0.0108 |
| 1:45 AM 12/7 | 3.4 | 0.011 |
| 1:30 AM 12/7 | 3.39 | 0.0108 |
| 8:45 PM 12/6 | 3.51 | 0.0142 |
| 8:30 PM 12/6 | 3.53 | 0.0146 |
| 8:15 PM 12/6 | 3.57 | 0.0154 |
| 8:00 PM 12/6 | 3.59 | 0.0158 |
| 7:45 PM 12/6 | 3.63 | 0.0169 |
| 7:30 PM 12/6 | 3.66 | 0.0177 |
| 5:45 PM 12/6 | 3.9 | 0.026 |
| 5:30 PM 12/6 | 3.93 | 0.0272 |
| 5:15 PM 12/6 | 3.96 | 0.0283 |
| 5:00 PM 12/6 | 4.01 | 0.0304 |
| 4:45 PM 12/6 | 4.03 | 0.0312 |
| 4:30 PM 12/6 | 4.05 | 0.0319 |
| 2:45 PM 12/6 | 4.27 | 0.0414 |
| 2:30 PM 12/6 | 4.29 | 0.0425 |
| 2:15 PM 12/6 | 4.31 | 0.0435 |
| 2:00 PM 12/6 | 4.35 | 0.0454 |
| 1:45 PM 12/6 | 4.37 | 0.0465 |
| 1:30 PM 12/6 | 4.39 | 0.0475 |
| 8:45 AM 12/6 | 4.52 | 0.0542 |
| 8:30 AM 12/6 | 4.5 | 0.053 |
| 8:15 AM 12/6 | 4.51 | 0.0536 |
| 8:00 AM 12/6 | 4.51 | 0.0536 |
| 7:45 AM 12/6 | 4.52 | 0.0542 |
| 7:30 AM 12/6 | 4.53 | 0.0547 |
16' -
There is 1-3 feet of water across downtown and NE side of town near Black Earth Creek. Water into first floor and basements of these homes. Water over road on Bridge St at bridge and County Road Y, on the northeast side of Mazomanie. Water over Hudson Rd on west side of village near the river.
15' -
Water is over Bridge St. at bridge on north side of town. There is 1 to 2 feet of water downtown and northeast side of town along Black Earth Creek.
11.9' -
Floodwaters affect Curtiss Street and other streets, including County Road Y, on the northeast side of Mazomanie.
11' -
Floodwaters affect Curtiss Street and other streets on the northeast side of Mazomanie.
10' -
Floodwaters affect Curtiss Street on the northeast side of Mazomanie. There is general lowland flooding in the Mazomanie area.
9' -
Between stages 8 feet to 10 feet, there is general overflow of the lowest banks resulting in minor lowland flooding.
8' -
There is general overflow of the lowest banks resulting in minor lowland flooding.
| Date | Stage (ft) |
|---|---|
| Aug 21, 2018 | 16.6 |
| Jun 9, 2008 | 11.91 |
| Mar 15, 2019 | 11.66 |
| Oct 2, 2019 | 10.95 |
| Jul 12, 2008 | 10.55 |
| Jun 16, 2016 | 10.37 |
| Jun 23, 2024 | 10.34 |
| Aug 20, 2007 | 9.62 |
| Jul 21, 2017 | 9.28 |
| Feb 14, 2005 | 8.87 |
| Feb 7, 2005 | 8.83 |
| Jan 29, 2013 | 8.75 |
| Mar 11, 2013 | 8.61 |
| Mar 9, 2009 | 8.12 |
| Apr 14, 2014 | 7.7 |
| Oct 27, 2016 | 7.7 |
| Jul 24, 2010 | 7.66 |
| Apr 27, 2009 | 7.31 |
| Apr 24, 2009 | 7.31 |
| Apr 10, 2015 | 7.27 |
Data provided by the National Weather Service.