Little Miami River at Milford
Critical Stages
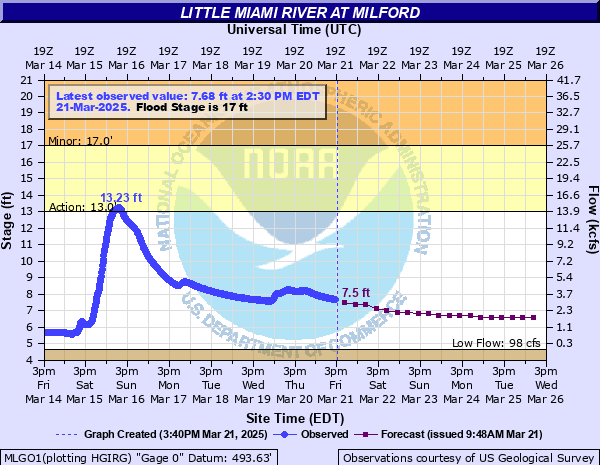
13' - Action
17' - Flood
22' - Moderate
27' - Major
Latest Observation
Updated: 2:30 PM EST 12/15/25
Status: No Flooding
Stage: 5.43 ft
Flow: 0.502 kcfs
Forecast
| Time | Stage (ft) | Flow (kcfs) |
|---|---|---|
| 7 PM 12/15 | 5.4 | 0.483 |
| 1 AM 12/16 | 5.4 | 0.483 |
| 7 AM 12/16 | 5.4 | 0.483 |
| 1 PM 12/16 | 5.4 | 0.483 |
| 7 PM 12/16 | 5.4 | 0.483 |
| 1 AM 12/17 | 5.4 | 0.483 |
| 7 AM 12/17 | 5.4 | 0.483 |
| 1 PM 12/17 | 5.4 | 0.483 |
| 7 PM 12/17 | 5.4 | 0.483 |
| 1 AM 12/18 | 5.4 | 0.483 |
| 7 AM 12/18 | 5.4 | 0.483 |
| 1 PM 12/18 | 5.5 | 0.547 |
| 7 PM 12/18 | 5.7 | 0.687 |
| 1 AM 12/19 | 6 | 0.929 |
| 7 AM 12/19 | 6.2 | 1.11 |
| 1 PM 12/19 | 6.4 | 1.31 |
| 7 PM 12/19 | 6.5 | 1.42 |
| 1 AM 12/20 | 6.5 | 1.42 |
| 7 AM 12/20 | 6.4 | 1.31 |
| Time | Stage (ft) | Flow (kcfs) |
|---|---|---|
| 3:30 PM 12/15 | 5.42 | 0.495 |
| 3:15 PM 12/15 | 5.42 | 0.495 |
| 3:00 PM 12/15 | 5.42 | 0.495 |
| 2:45 PM 12/15 | 5.43 | 0.502 |
| 2:30 PM 12/15 | 5.43 | 0.502 |
| 2:15 PM 12/15 | 5.44 | 0.508 |
| 2:00 PM 12/15 | 5.45 | 0.515 |
| 1:45 PM 12/15 | 5.45 | 0.515 |
| 1:30 PM 12/15 | 5.44 | 0.508 |
| 1:15 PM 12/15 | 5.42 | 0.495 |
| 1:00 PM 12/15 | 5.4 | 0.483 |
| 12:45 PM 12/15 | 5.37 | 0.464 |
| 12:30 PM 12/15 | 5.31 | 0.429 |
| 12:15 PM 12/15 | 5.28 | 0.413 |
| 12:00 PM 12/15 | 5.26 | 0.402 |
| 11:45 AM 12/15 | 5.24 | 0.391 |
| 11:30 AM 12/15 | 5.23 | 0.385 |
| 11:15 AM 12/15 | 5.23 | 0.385 |
| 11:00 AM 12/15 | 5.23 | 0.385 |
| 10:45 AM 12/15 | 5.23 | 0.385 |
| 10:30 AM 12/15 | 5.24 | 0.391 |
| 10:15 AM 12/15 | 5.25 | 0.397 |
| 10:00 AM 12/15 | 5.26 | 0.402 |
| 9:45 AM 12/15 | 5.27 | 0.408 |
| 9:30 AM 12/15 | 5.27 | 0.408 |
| 9:15 AM 12/15 | 5.28 | 0.413 |
| 9:00 AM 12/15 | 5.29 | 0.418 |
| 8:45 AM 12/15 | 5.3 | 0.424 |
| 8:30 AM 12/15 | 5.31 | 0.429 |
| 8:15 AM 12/15 | 5.32 | 0.435 |
30.5' -
This is equivalent to the flood of record of 1913 with much of Milford between High Street and the river experiencing major flooding. Several streets are under water including Locust, Cash, Elm, Water and Polk. Water also covers portions of Highway 50. Water is several feet deep through this area.
27' -
This is roughly the FEMA 1 Percent flood elevation. Several streets are under water including Locust, Cash, Elm, Water and Polk. Water also covers portions of Highway 50. The southwest area of south Milford street also floods. Lowland flooding also occurs in Terrace Park along areas east of Miami Avenue.
24' -
Significant flooding can be expected along Round Bottom Road in Anderson Township and in the Terrace Park Country Club area. Flooding will also occur between Main Street and the river in Milford.
23' -
Significant lowland flooding occurs along the river in Clermont and Hamilton Counties. Lowland flooding becomes a problem in the Terrace Park area and in Anderson Township, especially along Round Bottom Road. Flooding also occurs in Milford between Main Street and the river itself.
21' -
Flooding can be expected in low areas between Main Street and the river in Milford. Lowland flooding occurs along the river in Clermont and Hamilton Counties.
20' -
Lowland flooding continues in portions of Clermont and Hamilton Counties, particularly in low areas of Loveland near Karl Brown Way as well as along Cones Road and Cox Trailside Parking lot. Flooding continues along portions of Round Bottom Road in Anderson Township.
19' -
Flooding occurs in lowland areas of Milford and Terrace Park, including portions of Round Bottom Road in Anderson Township and Karl Brown Way near the railway underpass, Cones Road and Cox Trailside Parking lot in Loveland.
17' -
Lowland flooding occurs along the river in Clermont and Hamilton Counties, with flooding of Karl Brown Way near Loveland.
| Date | Stage (ft) |
|---|---|
| Mar 27, 1913 | 30.5 |
| Jan 22, 1959 | 27.3 |
| Jul 18, 2001 | 21.81 |
| Apr 16, 1998 | 21.69 |
| Mar 19, 2008 | 21.28 |
| Sep 14, 1979 | 21.18 |
| Mar 6, 1945 | 20.9 |
| Jan 5, 2004 | 20.62 |
| Feb 25, 2018 | 20.43 |
| Apr 20, 1940 | 20.1 |
| Mar 1, 2017 | 19.91 |
| Feb 18, 2022 | 19.65 |
| May 19, 2020 | 19.65 |
| Jan 22, 1937 | 19.55 |
| May 2, 2012 | 19.35 |
| Jun 1, 1997 | 19.33 |
| May 11, 1996 | 19.3 |
| Jan 30, 1994 | 19.3 |
| Apr 10, 1994 | 19.3 |
| Dec 6, 2011 | 19.13 |
Data provided by the National Weather Service.