Des Moines River at Des Moines SE 6th St
Critical Stages
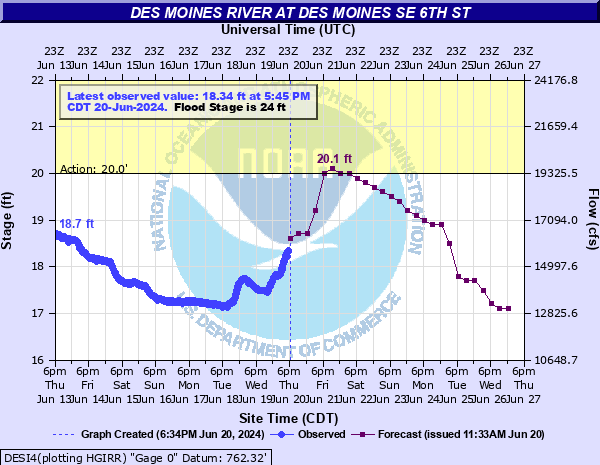
20' - Action
24' - Flood
26' - Moderate
30' - Major
Latest Observation
Updated: 2:00 PM CST 12/15/25
Status: No Flooding
Stage: 10.23 ft
Flow: 1.62 kcfs
Forecast
Forecast not available for this location.
| Time | Stage (ft) | Flow (kcfs) |
|---|---|---|
| 2:00 PM 12/15 | 10.23 | 1.62 |
| 1:45 PM 12/15 | 10.22 | 1.61 |
| 1:30 PM 12/15 | 10.22 | 1.61 |
| 1:15 PM 12/15 | 10.21 | 1.6 |
| 1:00 PM 12/15 | 10.21 | 1.6 |
| 12:45 PM 12/15 | 10.21 | 1.6 |
| 12:30 PM 12/15 | 10.2 | 1.59 |
| 12:15 PM 12/15 | 10.21 | 1.6 |
| 12:00 PM 12/15 | 10.2 | 1.59 |
| 11:45 AM 12/15 | 10.21 | 1.6 |
| 11:30 AM 12/15 | 10.23 | 1.62 |
| 11:15 AM 12/15 | 10.22 | 1.61 |
| 11:00 AM 12/15 | 10.24 | 1.64 |
| 10:45 AM 12/15 | 10.25 | 1.65 |
| 10:30 AM 12/15 | 10.26 | 1.66 |
| 10:15 AM 12/15 | 10.26 | 1.66 |
| 10:00 AM 12/15 | 10.26 | 1.66 |
| 9:45 AM 12/15 | 10.27 | 1.67 |
| 9:30 AM 12/15 | 10.27 | 1.67 |
| 9:15 AM 12/15 | 10.29 | 1.69 |
| 9:00 AM 12/15 | 10.3 | 1.7 |
| 8:45 AM 12/15 | 10.31 | 1.71 |
| 8:30 AM 12/15 | 10.31 | 1.71 |
| 8:15 AM 12/15 | 10.32 | 1.72 |
| 8:00 AM 12/15 | 10.31 | 1.71 |
| 7:45 AM 12/15 | 10.31 | 1.71 |
| 7:30 AM 12/15 | 10.31 | 1.71 |
| 7:15 AM 12/15 | 10.31 | 1.71 |
| 7:00 AM 12/15 | 10.31 | 1.71 |
| 6:45 AM 12/15 | 10.31 | 1.71 |
37.3' -
This is the top of the levee on the downstream side of SE 6th St.
35' -
Water affects the grass bowl of the Simon Estes Amphitheater.
34' -
Water surrounds Principal Park and approaches its entrances.
30' -
Water from the Des Moines River causes backwater impacts along portions of Fourmile Creek in the Vandalia Rd and S Pleasant Hill Blvd areas.
28.7' -
Simon Estes Amphitheater is inundated up to intersection of the arcing sidewalks.
28.5' -
Hartford Ave is closed from SE 22nd St to SE 30th Ct.
26.3' -
Water affects Arthur St east of Carlisle.
25.7' -
Water surrounds the base of Simon Estes Amphitheater.
24' -
The bike trail is closed east of Water St. Water affects portions of other bike trails.
| Date | Stage (ft) |
|---|---|
| Jun 13, 2008 | 35.55 |
| Jul 11, 1993 | 34.29 |
| May 31, 1903 | 32.06 |
| Jun 26, 1947 | 31.96 |
| Jun 24, 1954 | 31.24 |
| Jun 26, 2015 | 30.14 |
| Jul 2, 2010 | 29.83 |
| Apr 11, 1965 | 29.78 |
| Mar 16, 2019 | 29.16 |
| Mar 31, 1951 | 28.91 |
| Jul 1, 2018 | 28.87 |
| Apr 2, 1960 | 28.86 |
| May 24, 1944 | 28.76 |
| Jun 16, 1998 | 28.65 |
| Jun 19, 1984 | 28.46 |
| May 25, 2004 | 27.71 |
| Apr 27, 2007 | 27.37 |
| Apr 3, 1962 | 27.35 |
| Jul 2, 1986 | 27.31 |
| May 20, 1974 | 27.15 |
Data provided by the National Weather Service.