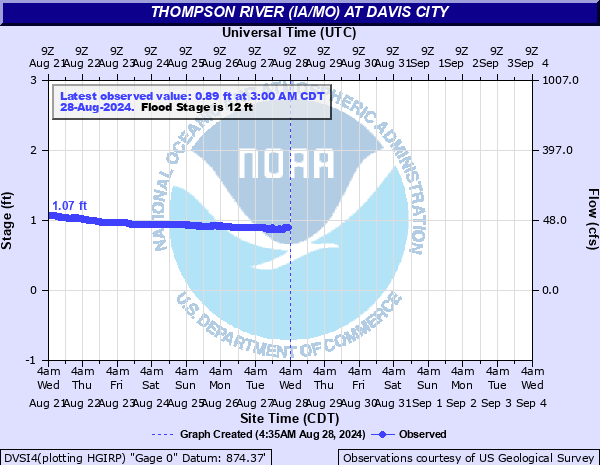
Thompson River at Davis City
Critical Stages
8' - Action
12' - Flood
20' - Moderate
24' - Major
Latest Observation
Updated: 2:00 PM CST 12/15/25
Status: No Flooding
Stage: 0.97 ft
Flow: -999 kcfs
Forecast
Forecast not available for this location.
| Time | Stage (ft) | Flow (kcfs) |
|---|---|---|
| 2:00 PM 12/15 | 0.97 | -999 |
| 1:45 PM 12/15 | 0.87 | -999 |
| 1:30 PM 12/15 | 0.83 | -999 |
| 1:15 PM 12/15 | 0.78 | -999 |
| 1:00 PM 12/15 | 0.75 | -999 |
| 12:45 PM 12/15 | 0.72 | -999 |
| 12:30 PM 12/15 | 0.71 | -999 |
| 12:15 PM 12/15 | 0.68 | -999 |
| 12:00 PM 12/15 | 0.68 | -999 |
| 11:45 AM 12/15 | 0.67 | -999 |
| 11:30 AM 12/15 | 0.66 | -999 |
| 11:15 AM 12/15 | 0.65 | -999 |
| 11:00 AM 12/15 | 0.64 | -999 |
| 10:45 AM 12/15 | 0.64 | -999 |
| 10:30 AM 12/15 | 0.62 | -999 |
| 10:15 AM 12/15 | 0.62 | -999 |
| 10:00 AM 12/15 | 0.62 | -999 |
| 9:45 AM 12/15 | 0.62 | -999 |
| 9:30 AM 12/15 | 0.62 | -999 |
| 9:15 AM 12/15 | 0.62 | -999 |
| 9:00 AM 12/15 | 0.62 | -999 |
| 8:45 AM 12/15 | 0.63 | -999 |
| 8:30 AM 12/15 | 0.63 | -999 |
| 8:15 AM 12/15 | 0.63 | -999 |
| 8:00 AM 12/15 | 0.62 | -999 |
| 7:45 AM 12/15 | 0.62 | -999 |
| 7:30 AM 12/15 | 0.61 | -999 |
| 7:15 AM 12/15 | 0.59 | -999 |
| 7:00 AM 12/15 | 0.57 | -999 |
| 6:45 AM 12/15 | 0.55 | -999 |
24' -
Water affects both lanes of I-35 along with many area highways and county roads. Widespread flooding occurs along both the Thompson River and its tributaries.
19' -
Water affects the Hwy R15 bridge crossings just north of Grand River. Flooding occurs in the low areas of Davis City.
13' -
Flooding of agricultural land occurs north of Davis City near I-35.
12' -
Widespread flooding occurs at the Davis City park including the campgrounds. Water affects Hwy R15 just north of the town of Grand River in northwest Decatur County.
11' -
Water affects the Davis City park and campgrounds.
10' -
Water affects gravel roads from Shewmaker Park to Oakhill cemetery near the town of Grand River in northwest Decatur County.
9' -
Water affects the low areas of the Davis City park as well as some rural roads.
| Date | Stage (ft) |
|---|---|
| Sep 16, 1992 | 24.29 |
| Aug 27, 1903 | 23 |
| Aug 8, 1885 | 22.8 |
| Jul 6, 1909 | 22.3 |
| Aug 16, 1914 | 22.2 |
| Jun 14, 1947 | 22.1 |
| Jul 18, 1922 | 21.9 |
| Apr 24, 1897 | 21.7 |
| Mar 28, 1915 | 21.6 |
| Sep 9, 1926 | 21.1 |
| Jun 26, 1924 | 21 |
| Jun 4, 1919 | 20.8 |
| Jul 5, 1993 | 20.53 |
| Aug 6, 1959 | 20.42 |
| Jun 10, 1974 | 19.43 |
| Nov 13, 1922 | 19.4 |
| May 8, 2007 | 18.9 |
| Mar 24, 1920 | 18.9 |
| Mar 30, 1960 | 18.63 |
| Jan 6, 1946 | 17.2 |
Data provided by the National Weather Service.