« Back to Mineral Wells Rivers
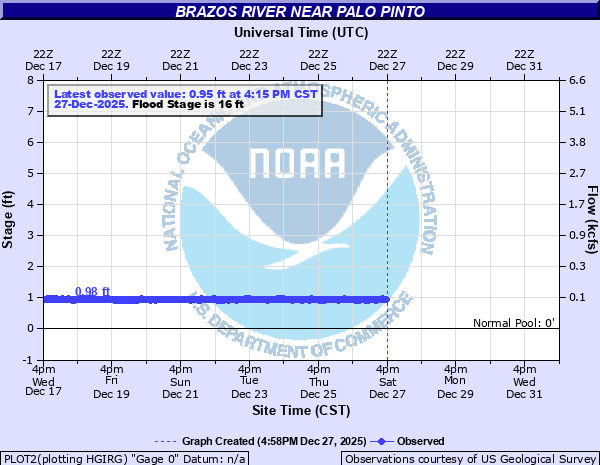
Brazos River near Palo Pinto
Critical Stages
14' - Action
16' - Flood
18' - Moderate
22' - Major
Latest Observation
Updated: 12:00 PM CST 12/15/25
Status: No Flooding
Stage: 0.95 ft
Flow: 0.0501 kcfs
Forecast
Forecast not available for this location.
| Time | Stage (ft) | Flow (kcfs) |
|---|---|---|
| 12:30 PM 12/15 | 0.94 | 0.0487 |
| 12:15 PM 12/15 | 0.96 | 0.0517 |
| 12:00 PM 12/15 | 0.95 | 0.0501 |
| 11:45 AM 12/15 | 0.95 | 0.0501 |
| 11:30 AM 12/15 | 0.96 | 0.0517 |
| 11:15 AM 12/15 | 0.95 | 0.0501 |
| 11:00 AM 12/15 | 0.95 | 0.0501 |
| 10:45 AM 12/15 | 0.95 | 0.0501 |
| 10:30 AM 12/15 | 0.94 | 0.0487 |
| 10:15 AM 12/15 | 0.94 | 0.0487 |
| 10:00 AM 12/15 | 0.93 | 0.0472 |
| 9:45 AM 12/15 | 0.96 | 0.0517 |
| 9:30 AM 12/15 | 0.95 | 0.0501 |
| 9:15 AM 12/15 | 0.94 | 0.0487 |
| 9:00 AM 12/15 | 0.94 | 0.0487 |
| 8:45 AM 12/15 | 0.93 | 0.0472 |
| 8:30 AM 12/15 | 0.92 | 0.0458 |
| 8:15 AM 12/15 | 0.93 | 0.0472 |
| 8:00 AM 12/15 | 0.94 | 0.0487 |
| 7:45 AM 12/15 | 0.94 | 0.0487 |
| 7:30 AM 12/15 | 0.94 | 0.0487 |
| 7:15 AM 12/15 | 0.94 | 0.0487 |
| 7:00 AM 12/15 | 0.94 | 0.0487 |
| 6:45 AM 12/15 | 0.95 | 0.0501 |
| 6:30 AM 12/15 | 0.94 | 0.0487 |
| 6:15 AM 12/15 | 0.94 | 0.0487 |
| 6:00 AM 12/15 | 0.94 | 0.0487 |
| 5:45 AM 12/15 | 0.95 | 0.0501 |
| 5:30 AM 12/15 | 0.94 | 0.0487 |
| 5:15 AM 12/15 | 0.95 | 0.0501 |
33' -
Major river flooding is expected. Cabins and a house at the Crosby canoe rental will be well underwater.
29' -
Major river flooding is expected. Cabins and a house at the Crosby canoe rental will be underwater.
26.5' -
Major river flooding is expected. Cabins and a house at the Crosby canoe rental will be well underwater.
23' -
Major river flooding is expected. Cabins and a house at the Crosby canoe rental will be flooded.
22' -
Major river flooding is expected. Cabins and a house at the Crosby canoe rental will be flooded.
18' -
Moderate river flooding is expected. Numerous trailer homes will flood at Pleasant Valley.
16' -
Minor flooding is expected. Out buildings at the canoe rental near the river will begin to flood.
| Date | Stage (ft) |
|---|---|
| Jun 16, 1930 | 30 |
| Apr 29, 1957 | 28.87 |
| Oct 13, 1981 | 26.53 |
| Apr 27, 1990 | 23.25 |
| Aug 8, 1978 | 22.93 |
| Jul 1, 2007 | 22.89 |
| Dec 20, 1991 | 21.67 |
| Feb 20, 1997 | 21.18 |
| Mar 18, 2020 | 21.15 |
| Jun 1, 2016 | 21.09 |
| Sep 27, 1955 | 20.53 |
| May 27, 2015 | 20.33 |
| Jun 8, 2021 | 19.99 |
| Apr 18, 2010 | 19.91 |
| Jul 3, 2007 | 19.16 |
| Jun 4, 2016 | 18.98 |
| Mar 31, 2007 | 18.78 |
| May 15, 2010 | 18.47 |
| May 1, 1966 | 18.42 |
| Oct 17, 1942 | 17.42 |
Data provided by the National Weather Service.