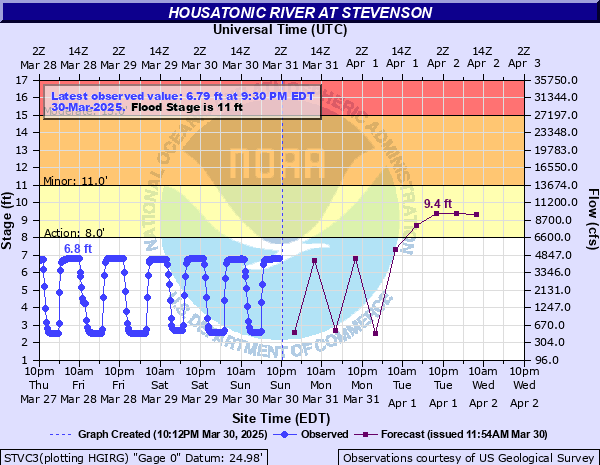
Housatonic River at Stevenson
Critical Stages
8' - Action
11' - Flood
15' - Moderate
20' - Major
Latest Observation
Updated: 9:30 AM EST 12/15/25
Status: No Flooding
Stage: 2.52 ft
Flow: 0.477 kcfs
Forecast
| Time | Stage (ft) | Flow (kcfs) |
|---|---|---|
| 1 PM 12/15 | 2.9 | 0.625 |
| 7 PM 12/15 | 3.3 | 0.812 |
| 1 AM 12/16 | 3.6 | 0.98 |
| 7 AM 12/16 | 3.9 | 1.18 |
| 1 PM 12/16 | 3.9 | 1.18 |
| 7 PM 12/16 | 3.9 | 1.18 |
| 1 AM 12/17 | 4.1 | 1.32 |
| 7 AM 12/17 | 4.1 | 1.32 |
| Time | Stage (ft) | Flow (kcfs) |
|---|---|---|
| 9:30 AM 12/15 | 2.52 | 0.477 |
| 9:15 AM 12/15 | 2.51 | 0.473 |
| 9:00 AM 12/15 | 2.5 | 0.47 |
| 8:45 AM 12/15 | 2.52 | 0.477 |
| 8:30 AM 12/15 | 2.52 | 0.477 |
| 8:15 AM 12/15 | 2.52 | 0.477 |
| 8:00 AM 12/15 | 2.53 | 0.481 |
| 7:45 AM 12/15 | 2.54 | 0.484 |
| 7:30 AM 12/15 | 2.53 | 0.481 |
| 7:15 AM 12/15 | 2.53 | 0.481 |
| 7:00 AM 12/15 | 2.54 | 0.484 |
| 6:45 AM 12/15 | 2.53 | 0.481 |
| 6:30 AM 12/15 | 2.53 | 0.481 |
| 5:30 AM 12/15 | 2.52 | 0.477 |
| 5:15 AM 12/15 | 2.52 | 0.477 |
| 5:00 AM 12/15 | 2.52 | 0.477 |
| 4:45 AM 12/15 | 2.53 | 0.481 |
| 4:30 AM 12/15 | 2.52 | 0.477 |
| 4:15 AM 12/15 | 2.53 | 0.481 |
| 4:00 AM 12/15 | 2.53 | 0.481 |
| 3:45 AM 12/15 | 2.52 | 0.477 |
| 3:30 AM 12/15 | 2.53 | 0.481 |
| 3:15 AM 12/15 | 2.52 | 0.477 |
| 3:00 AM 12/15 | 2.52 | 0.477 |
| 2:45 AM 12/15 | 2.53 | 0.481 |
| 2:30 AM 12/15 | 2.53 | 0.481 |
| 2:15 AM 12/15 | 2.53 | 0.481 |
| 2:00 AM 12/15 | 2.53 | 0.481 |
| 1:45 AM 12/15 | 2.53 | 0.481 |
| 1:30 AM 12/15 | 2.53 | 0.481 |
20' -
Major flood stage with widespread inundation of low lying properties from Stevenson south to Bridgeport.
15' -
Moderate flood stage with numerous homes in the Maples area of Shelton affected.
11.5' -
Water reaches the Maples area of Shelton.
11' -
Flood stage.
9.5' -
Water reaches low lying areas in the Riverside neighborhood of Oxford.
8' -
The river is about a foot above the top end of normal generation levels.
7' -
The river is at the top end of normal generation levels.
2' -
The river is at the low end of normal generation levels.
| Date | Stage (ft) |
|---|---|
| Aug 19, 1955 | 24.5 |
| Oct 16, 1955 | 24.5 |
| Mar 12, 1936 | 23.5 |
| May 30, 1984 | 22.36 |
| Mar 7, 2011 | 21.68 |
| Sep 22, 1938 | 21.5 |
| Aug 28, 2011 | 20.93 |
| Sep 8, 2011 | 20.53 |
| Aug 18, 2024 | 20.51 |
| Apr 16, 2007 | 19.98 |
| Dec 31, 1948 | 19.97 |
| Jan 27, 1996 | 18.88 |
| Oct 15, 2005 | 18.09 |
| Mar 22, 1980 | 17.2 |
| Apr 5, 1987 | 17.2 |
| Sep 2, 2021 | 16.97 |
| Mar 7, 1979 | 16.9 |
| Mar 18, 1936 | 16.86 |
| Sep 30, 2023 | 16.71 |
| Sep 27, 1975 | 16.7 |
Data provided by the National Weather Service.