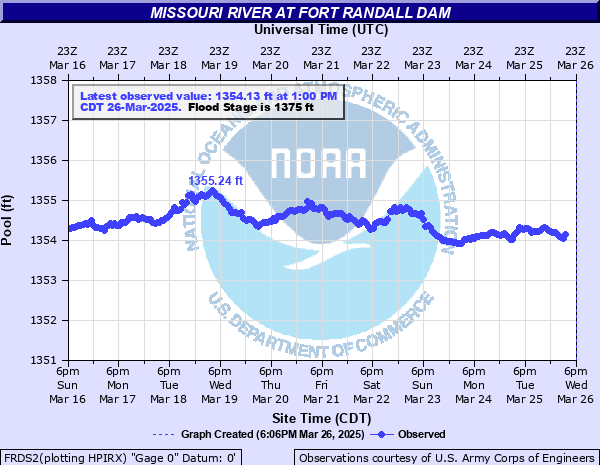
Missouri River at Fort Randall Dam
Critical Stages
1365' - Action
1375' - Flood
1379' - Moderate
1395' - Major
Latest Observation
Updated: 2:00 PM CST 12/15/25
Status: No Flooding
Stage: 1338.82 ft
Flow: -999 kcfs
Forecast
Forecast not available for this location.
| Time | Stage (ft) | Flow (kcfs) |
|---|---|---|
| 2:00 PM 12/15 | 1338.82 | -999 |
| 1:00 PM 12/15 | 1338.82 | -999 |
| 12:00 PM 12/15 | 1338.86 | -999 |
| 11:00 AM 12/15 | 1338.86 | -999 |
| 10:00 AM 12/15 | 1338.88 | -999 |
| 9:00 AM 12/15 | 1338.9 | -999 |
| 8:00 AM 12/15 | 1338.9 | -999 |
| 7:00 AM 12/15 | 1338.96 | -999 |
| 6:00 AM 12/15 | 1338.88 | -999 |
| 5:00 AM 12/15 | 1338.92 | -999 |
| 4:00 AM 12/15 | 1338.9 | -999 |
| 3:00 AM 12/15 | 1338.88 | -999 |
| 2:00 AM 12/15 | 1338.86 | -999 |
| 1:00 AM 12/15 | 1338.86 | -999 |
| 12:00 AM 12/15 | 1338.84 | -999 |
| 11:00 PM 12/14 | 1338.81 | -999 |
| 10:00 PM 12/14 | 1338.75 | -999 |
| 9:00 PM 12/14 | 1338.75 | -999 |
| 8:00 PM 12/14 | 1338.77 | -999 |
| 7:00 PM 12/14 | 1338.73 | -999 |
| 6:00 PM 12/14 | 1338.73 | -999 |
| 5:00 PM 12/14 | 1338.73 | -999 |
| 4:00 PM 12/14 | 1338.81 | -999 |
| 3:00 PM 12/14 | 1338.81 | -999 |
| 2:00 PM 12/14 | 1338.81 | -999 |
| 1:00 PM 12/14 | 1338.82 | -999 |
| 12:00 PM 12/14 | 1338.84 | -999 |
| 11:00 AM 12/14 | 1338.88 | -999 |
| 10:00 AM 12/14 | 1338.9 | -999 |
| 9:00 AM 12/14 | 1338.92 | -999 |
1395' -
Elevation of the top of the dam.
1379.3' -
Elevation at maximum spillway design discharge capacity.
1375' -
Maximum capacity of the reservoir. Water reaches the top of the boat ramps at North Point (Prairie Dog Bay) and South Shore.
1371' -
Water reaches the top of the boat ramps at Joe Day Bay and North Wheeler.
1368' -
Water reaches the top of the boat ramp at Whetstone Bay B.
1365' -
Base of the exclusive flood control zone. Water reaches the top of the boat ramps at South Scalp #1, Platte Creek and Pease Creek
1362' -
Water reaches the top of the boat ramp at White Swan.
1361' -
water reaches the top of the boat ramps at North Point, North Bay and St. Francis Bay, as well as South Wheeler.
1360' -
The boat ramps at Randall Creek recreation area and the spillway lakeside use area below the dam are closed.
1358' -
Water reaches the top of the boat ramp at Whetstone Bay A.
1350' -
Base flood control elevation.
1346' -
Spillway crest elevation.
1310' -
Inactive storage elevation.
1227' -
Dead storage elevation.
| Date | Stage (ft) |
|---|---|
| Jul 11, 2011 | 1374.04 |
| May 7, 1997 | 1372.17 |
| Jun 1, 2019 | 1370.4 |
| Jun 1, 2010 | 1368.1 |
| Jun 1, 1995 | 1367.76 |
| Jun 1, 1967 | 1366.5 |
| Apr 1, 2001 | 1365.3 |
| May 1, 1972 | 1365 |
| Jun 1, 1984 | 1364.4 |
| Jul 1, 1975 | 1362.8 |
| May 1, 1970 | 1362.5 |
| Apr 1, 1978 | 1362.5 |
| Apr 1, 1987 | 1362.4 |
| Jun 1, 2008 | 1362.1 |
| May 1, 1986 | 1362 |
| Jun 1, 1971 | 1361.9 |
| Jul 6, 2024 | 1361.2 |
| Jun 28, 1996 | 1361.11 |
| Apr 1, 1979 | 1361.1 |
| May 1, 1969 | 1361 |
Data provided by the National Weather Service.