Missouri River at Niobrara
Critical Stages
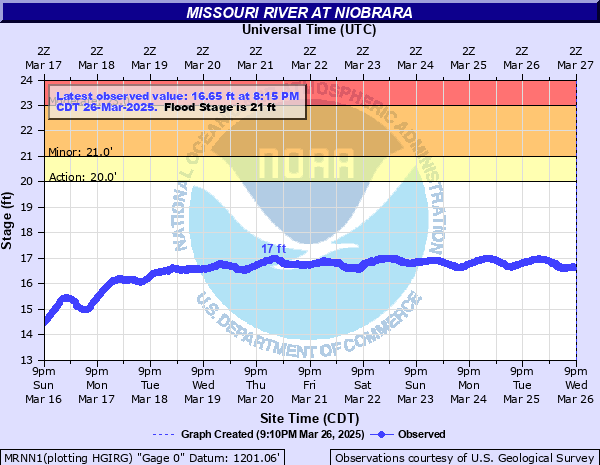
20' - Action
21' - Flood
23' - Moderate
24' - Major
Latest Observation
Updated: 2:15 PM CST 12/15/25
Status: No Flooding
Stage: 13.89 ft
Flow: -999 kcfs
Forecast
Forecast not available for this location.
| Time | Stage (ft) | Flow (kcfs) |
|---|---|---|
| 2:15 PM 12/15 | 13.89 | -999 |
| 2:00 PM 12/15 | 13.92 | -999 |
| 1:45 PM 12/15 | 13.93 | -999 |
| 1:30 PM 12/15 | 13.97 | -999 |
| 1:15 PM 12/15 | 13.99 | -999 |
| 1:00 PM 12/15 | 14.02 | -999 |
| 12:45 PM 12/15 | 14.05 | -999 |
| 12:30 PM 12/15 | 14.08 | -999 |
| 12:15 PM 12/15 | 14.11 | -999 |
| 12:00 PM 12/15 | 14.13 | -999 |
| 11:45 AM 12/15 | 14.16 | -999 |
| 11:30 AM 12/15 | 14.2 | -999 |
| 11:15 AM 12/15 | 14.22 | -999 |
| 11:00 AM 12/15 | 14.25 | -999 |
| 10:45 AM 12/15 | 14.27 | -999 |
| 10:30 AM 12/15 | 14.3 | -999 |
| 10:15 AM 12/15 | 14.3 | -999 |
| 10:00 AM 12/15 | 14.36 | -999 |
| 9:45 AM 12/15 | 14.38 | -999 |
| 9:30 AM 12/15 | 14.4 | -999 |
| 9:15 AM 12/15 | 14.43 | -999 |
| 9:00 AM 12/15 | 14.45 | -999 |
| 8:45 AM 12/15 | 14.48 | -999 |
| 8:30 AM 12/15 | 14.5 | -999 |
| 8:15 AM 12/15 | 14.52 | -999 |
| 8:00 AM 12/15 | 14.55 | -999 |
| 7:45 AM 12/15 | 14.56 | -999 |
| 7:30 AM 12/15 | 14.58 | -999 |
| 7:15 AM 12/15 | 14.6 | -999 |
| 7:00 AM 12/15 | 14.62 | -999 |
25.5' -
Bottom Road in Bon Homme County begins flooding.
24' -
Highway 12 east and west of Niobrara will be flooded, and the sewage lagoons in Niobrara will be flooded. Homes and cabins in Running Water will also be threatened by high water.
23' -
Highway 12 east of Niobrara could be overtopped by water backing up Bazile Creek.
22.5' -
The fishing road on the south bank near Niobrara is flooded.
22' -
The road to the Niobrara sewer lagoon is flooded.
21' -
Both banks overflow and some boat docks near Niobrara are flooded.
| Date | Stage (ft) |
|---|---|
| Jun 26, 2011 | 26.76 |
| Jul 22, 2010 | 23.64 |
| Jan 17, 2007 | 22.5 |
| Aug 5, 2018 | 22.2 |
| Oct 13, 1997 | 21.98 |
| Aug 20, 1997 | 21.85 |
| Aug 1, 2006 | 21.44 |
| Jan 6, 1999 | 21.44 |
| Jul 28, 1996 | 21.28 |
| Jan 30, 2004 | 20.84 |
| Oct 7, 1999 | 20.72 |
| Jun 2, 2017 | 20.54 |
| Sep 24, 2005 | 20.51 |
| Sep 13, 2002 | 20.3 |
| Jan 19, 2003 | 20.03 |
| Sep 11, 2001 | 19.72 |
| Jan 17, 2024 | 18.89 |
| Jun 10, 2020 | 18.27 |
| Oct 13, 2023 | 18.1 |
| Sep 30, 2021 | 17.27 |
Data provided by the National Weather Service.