« Back to Monroe Township Rivers
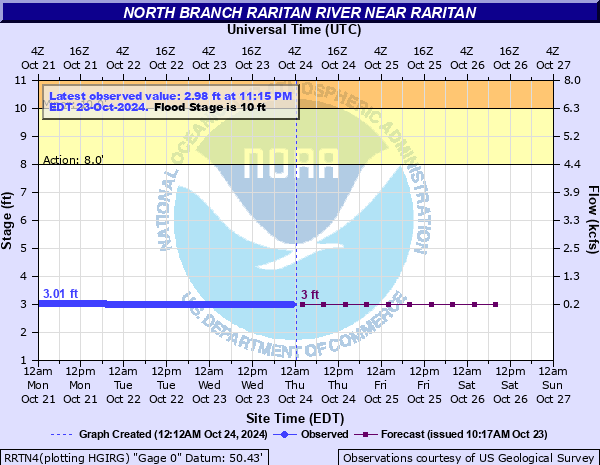
North Branch Raritan River near Raritan
Critical Stages
8' - Action
10' - Flood
12' - Moderate
15' - Major
Latest Observation
Updated: 9:00 AM EST 12/6/25
Status: No Flooding
Stage: 2.79 ft
Flow: 0.141 kcfs
Forecast
| Time | Stage (ft) | Flow (kcfs) |
|---|---|---|
| 1 PM 12/6 | 2.8 | 0.145 |
| 7 PM 12/6 | 2.8 | 0.145 |
| 1 AM 12/7 | 2.8 | 0.145 |
| 7 AM 12/7 | 2.8 | 0.145 |
| 1 PM 12/7 | 2.8 | 0.145 |
| 7 PM 12/7 | 2.8 | 0.145 |
| 1 AM 12/8 | 2.8 | 0.145 |
| 7 AM 12/8 | 2.8 | 0.145 |
| Time | Stage (ft) | Flow (kcfs) |
|---|---|---|
| 9:00 AM 12/6 | 2.79 | 0.141 |
| 8:45 AM 12/6 | 2.79 | 0.141 |
| 8:30 AM 12/6 | 2.79 | 0.141 |
| 8:15 AM 12/6 | 2.79 | 0.141 |
| 8:00 AM 12/6 | 2.79 | 0.141 |
| 7:45 AM 12/6 | 2.79 | 0.141 |
| 7:30 AM 12/6 | 2.79 | 0.141 |
| 7:15 AM 12/6 | 2.79 | 0.141 |
| 7:00 AM 12/6 | 2.79 | 0.141 |
| 6:45 AM 12/6 | 2.79 | 0.141 |
| 6:30 AM 12/6 | 2.79 | 0.141 |
| 6:15 AM 12/6 | 2.79 | 0.141 |
| 6:00 AM 12/6 | 2.79 | 0.141 |
| 5:45 AM 12/6 | 2.79 | 0.141 |
| 5:30 AM 12/6 | 2.79 | 0.141 |
| 5:15 AM 12/6 | 2.79 | 0.141 |
| 5:00 AM 12/6 | 2.79 | 0.141 |
| 4:45 AM 12/6 | 2.79 | 0.141 |
| 4:30 AM 12/6 | 2.79 | 0.141 |
| 4:15 AM 12/6 | 2.79 | 0.141 |
| 4:00 AM 12/6 | 2.79 | 0.141 |
| 3:45 AM 12/6 | 2.79 | 0.141 |
| 3:30 AM 12/6 | 2.79 | 0.141 |
| 3:15 AM 12/6 | 2.78 | 0.137 |
| 3:00 AM 12/6 | 2.79 | 0.141 |
| 2:45 AM 12/6 | 2.78 | 0.137 |
| 2:30 AM 12/6 | 2.78 | 0.137 |
| 2:15 AM 12/6 | 2.79 | 0.141 |
| 2:00 AM 12/6 | 2.79 | 0.141 |
| 1:45 AM 12/6 | 2.79 | 0.141 |
20' -
US Route 202 is closed. Flooding extends west of Vanderveer Avenue to Burnt Mill Road.
19' -
The bridge on Old York Road between Branchburg and Bridgewater is closed due to flooding.
18' -
Helfreds Landing in Bridgewater floods.
15' -
US Route 202 in Branchburg begins to flood, starting with the northbound lanes. Chambers Brook experiences back water causing flooding to occur along Chambers Brook Road.
14' -
The first evacuations begin in Branchburg near Route 28 and Vaanderveer Avenue.
12' -
Vaanderveer Avenue in Branchburg begins to flood.
10' -
Flooding begins along Old York Road and in Branchburg.
8' -
North Branch Park floods.
| Date | Stage (ft) |
|---|---|
| Sep 2, 2021 | 19.52 |
| Sep 16, 1999 | 18.98 |
| Aug 28, 2011 | 17.97 |
| Aug 28, 1971 | 15.47 |
| Oct 19, 1996 | 15.44 |
| Jul 7, 1984 | 15.3 |
| Jan 19, 1996 | 14.3 |
| Jan 10, 2024 | 14.1 |
| Mar 14, 2010 | 13.9 |
| Aug 19, 1955 | 13.59 |
| Dec 18, 2023 | 13.54 |
| May 1, 2014 | 13.29 |
| Apr 16, 2007 | 13.2 |
| Aug 13, 1955 | 12.7 |
| Sep 8, 2011 | 12.7 |
| Oct 15, 1955 | 12.68 |
| Sep 21, 1938 | 12.16 |
| Jul 23, 2004 | 11.95 |
| Aug 23, 2021 | 11.88 |
| Jan 25, 1979 | 11.87 |
Data provided by the National Weather Service.