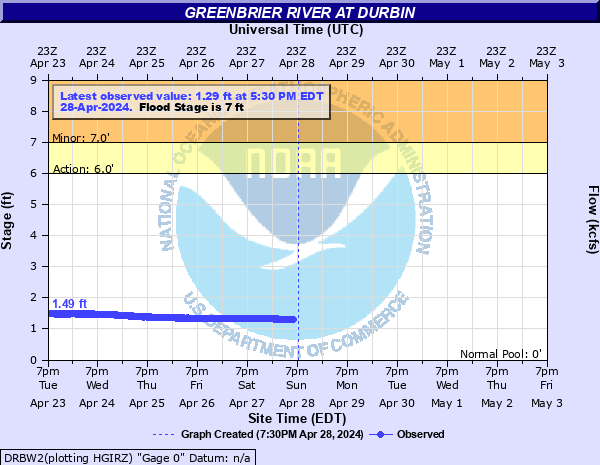
Greenbrier River at Durbin
Critical Stages
6' - Action
7' - Flood
10' - Moderate
15' - Major
Latest Observation
Updated: 12:35 AM EST 12/16/25
Status: No Flooding
Stage: 1.97 ft
Flow: 0.273 kcfs
Forecast
Forecast not available for this location.
| Time | Stage (ft) | Flow (kcfs) |
|---|---|---|
| 12:35 AM 12/16 | 1.97 | 0.273 |
| 12:20 AM 12/16 | 1.97 | 0.273 |
| 12:05 AM 12/16 | 1.98 | 0.277 |
| 11:50 PM 12/15 | 1.97 | 0.273 |
| 11:35 PM 12/15 | 1.97 | 0.273 |
| 11:20 PM 12/15 | 1.97 | 0.273 |
| 11:05 PM 12/15 | 1.97 | 0.273 |
| 10:50 PM 12/15 | 1.97 | 0.273 |
| 10:35 PM 12/15 | 1.96 | 0.27 |
| 10:20 PM 12/15 | 1.97 | 0.273 |
| 10:05 PM 12/15 | 1.97 | 0.273 |
| 9:50 PM 12/15 | 1.96 | 0.27 |
| 9:35 PM 12/15 | 1.96 | 0.27 |
| 9:20 PM 12/15 | 1.96 | 0.27 |
| 9:05 PM 12/15 | 1.95 | 0.266 |
| 8:50 PM 12/15 | 1.94 | 0.263 |
| 8:20 PM 12/15 | 1.92 | 0.255 |
| 8:05 PM 12/15 | 1.91 | 0.252 |
| 7:50 PM 12/15 | 1.9 | 0.248 |
| 7:35 PM 12/15 | 1.89 | 0.245 |
| 7:20 PM 12/15 | 1.88 | 0.241 |
| 7:05 PM 12/15 | 1.86 | 0.234 |
| 6:50 PM 12/15 | 1.84 | 0.227 |
| 6:35 PM 12/15 | 1.83 | 0.224 |
| 6:20 PM 12/15 | 1.81 | 0.218 |
| 6:05 PM 12/15 | 1.79 | 0.211 |
| 5:50 PM 12/15 | 1.77 | 0.205 |
| 5:35 PM 12/15 | 1.75 | 0.199 |
| 5:20 PM 12/15 | 1.72 | 0.19 |
| 5:05 PM 12/15 | 1.69 | 0.181 |
15' -
Train station, Meadow Lane, and River Road near train tracks flood. Sections of East River Road flood.
14' -
Campground along the East Fork of the Greenbrier River floods. Water surrounds home next to the train station.
10' -
Most low sections along the Greenbrier River and along the East and West Forks of the Greenbrier River flood.
7' -
A few low sections along the Greenbrier River and along the East and West Forks of the Greenbrier River flood.
| Date | Stage (ft) |
|---|---|
| Nov 4, 1985 | 15.82 |
| Jan 25, 2010 | 11.8 |
| Feb 2, 1956 | 9.2 |
| Mar 7, 1967 | 9.15 |
| Mar 20, 1982 | 8.76 |
| Oct 15, 1954 | 8.38 |
| Feb 9, 1994 | 8.11 |
| Jul 31, 1996 | 8.06 |
| Oct 9, 1976 | 8.06 |
| Dec 2, 1991 | 7.93 |
| Feb 6, 2025 | 7.88 |
| May 8, 1994 | 7.62 |
| Feb 16, 1979 | 7.52 |
| Mar 5, 2008 | 7.51 |
| Mar 5, 1964 | 7.48 |
| Apr 16, 2018 | 7.4 |
| Mar 19, 1963 | 7.34 |
| Feb 6, 2004 | 7.33 |
| Feb 19, 2000 | 7.32 |
| Mar 1, 2021 | 7.2 |
Data provided by the National Weather Service.