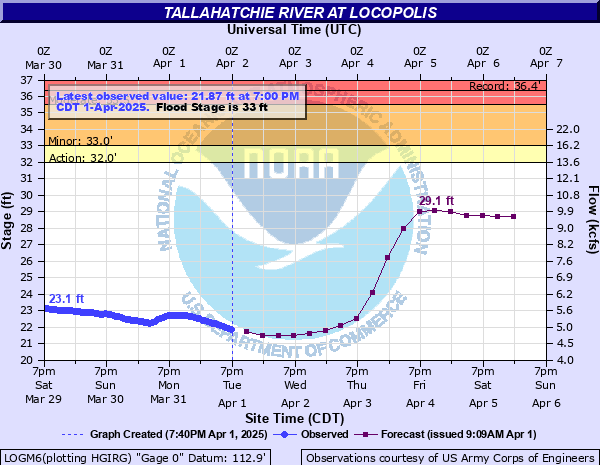
Tallahatchie River at Locopolis
Critical Stages
32' - Action
33' - Flood
35.5' - Moderate
38' - Major
Latest Observation
Updated: 1:00 PM CST 12/15/25
Status: No Flooding
Stage: 14.4 ft
Flow: 1.71 kcfs
Forecast
| Time | Stage (ft) | Flow (kcfs) |
|---|---|---|
| 6 PM 12/15 | 14.3 | 1.67 |
| 12 AM 12/16 | 14.2 | 1.64 |
| 6 AM 12/16 | 14.2 | 1.64 |
| 12 PM 12/16 | 14.1 | 1.61 |
| 6 PM 12/16 | 14 | 1.58 |
| 12 AM 12/17 | 13.9 | 1.55 |
| 6 AM 12/17 | 13.8 | 1.52 |
| 12 PM 12/17 | 13.8 | 1.52 |
| 6 PM 12/17 | 13.7 | 1.49 |
| 12 AM 12/18 | 13.7 | 1.49 |
| 6 AM 12/18 | 13.6 | 1.46 |
| 12 PM 12/18 | 13.6 | 1.46 |
| 6 PM 12/18 | 13.6 | 1.46 |
| 12 AM 12/19 | 13.5 | 1.44 |
| 6 AM 12/19 | 13.5 | 1.44 |
| 12 PM 12/19 | 13.5 | 1.44 |
| 6 PM 12/19 | 13.5 | 1.44 |
| 12 AM 12/20 | 13.5 | 1.44 |
| 6 AM 12/20 | 13.4 | 1.41 |
| Time | Stage (ft) | Flow (kcfs) |
|---|---|---|
| 1:00 PM 12/15 | 14.4 | 1.71 |
| 12:00 PM 12/15 | 14.42 | 1.71 |
| 11:00 AM 12/15 | 14.44 | 1.72 |
| 9:00 AM 12/15 | 14.43 | 1.71 |
| 8:00 AM 12/15 | 14.46 | 1.72 |
| 7:00 AM 12/15 | 14.52 | 1.74 |
| 6:00 AM 12/15 | 14.54 | 1.75 |
| 5:00 AM 12/15 | 14.56 | 1.76 |
| 4:00 AM 12/15 | 14.58 | 1.76 |
| 3:00 AM 12/15 | 14.61 | 1.77 |
| 2:00 AM 12/15 | 14.63 | 1.78 |
| 1:00 AM 12/15 | 14.66 | 1.79 |
| 12:00 AM 12/15 | 14.67 | 1.79 |
| 11:00 PM 12/14 | 14.69 | 1.8 |
| 10:00 PM 12/14 | 14.69 | 1.8 |
| 9:00 PM 12/14 | 14.64 | 1.78 |
| 8:00 PM 12/14 | 14.75 | 1.82 |
| 7:00 PM 12/14 | 14.81 | 1.84 |
| 6:00 PM 12/14 | 14.83 | 1.84 |
| 5:00 PM 12/14 | 14.85 | 1.85 |
| 4:00 PM 12/14 | 14.86 | 1.85 |
| 3:00 PM 12/14 | 14.9 | 1.87 |
| 2:00 PM 12/14 | 14.88 | 1.86 |
| 1:00 PM 12/14 | 14.86 | 1.85 |
| 12:00 PM 12/14 | 14.9 | 1.87 |
| 11:00 AM 12/14 | 14.96 | 1.89 |
| 10:00 AM 12/14 | 14.99 | 1.9 |
| 9:00 AM 12/14 | 14.98 | 1.89 |
| 8:00 AM 12/14 | 15.04 | 1.91 |
| 7:00 AM 12/14 | 15.09 | 1.93 |
36' -
Numerous secondary roads are covered by flood waters. Access to low-lying areas is restricted due to high water.
35' -
Significant amount of farm land and several homes near the river are flooded.
34' -
Widespread farm land flooding is occurring in Quitman and Tallahatchie Counties.
33' -
Flooding is occurring along both banks of the river.
32' -
Low-lying farm land near the river is flooded.
31' -
Low-lying farmland near the river is flooding.
| Date | Stage (ft) |
|---|---|
| Mar 17, 1973 | 36.39 |
| Feb 25, 2019 | 35.43 |
| Feb 21, 1991 | 35.3 |
| Dec 29, 1982 | 34.9 |
| Feb 6, 1990 | 34.63 |
| Jan 3, 2003 | 34.24 |
| Feb 16, 2004 | 34.19 |
| Dec 5, 1983 | 34.1 |
| Mar 4, 1997 | 33.9 |
| Feb 12, 1994 | 33.83 |
| Mar 1, 2001 | 33.6 |
| Dec 25, 1986 | 33.5 |
| Oct 12, 2002 | 33.39 |
| Jan 14, 1992 | 33.33 |
| Mar 8, 1995 | 32.74 |
| Dec 30, 1996 | 32.37 |
| Feb 25, 1985 | 32.2 |
| Apr 4, 2000 | 32 |
| Jan 26, 1993 | 30.88 |
| Dec 21, 2017 | 29.19 |
Data provided by the National Weather Service.