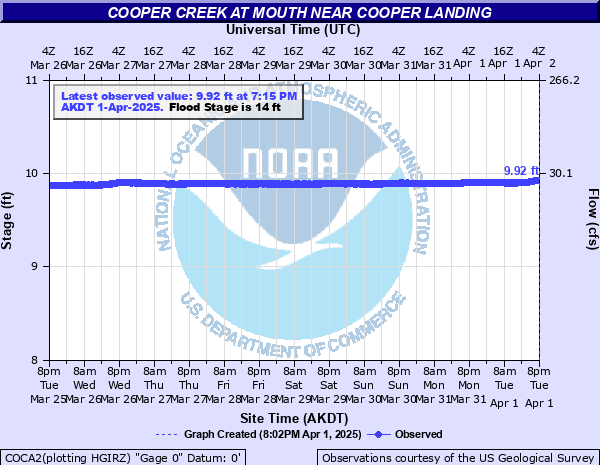
Cooper Creek at Mouth near Cooper Landing
Critical Stages
13' - Action
14' - Flood
15' - Moderate
16' - Major
Latest Observation
Updated: 10:15 AM AKST 12/9/25
Status: No Flooding
Stage: 11.67 ft
Flow: 0.665 kcfs
Forecast
Forecast not available for this location.
| Time | Stage (ft) | Flow (kcfs) |
|---|---|---|
| 10:15 AM 12/9 | 11.67 | 0.665 |
| 10:00 AM 12/9 | 11.66 | 0.657 |
| 9:45 AM 12/9 | 11.65 | 0.648 |
| 9:30 AM 12/9 | 11.65 | 0.648 |
| 9:15 AM 12/9 | 11.64 | 0.64 |
| 9:00 AM 12/9 | 11.63 | 0.632 |
| 8:45 AM 12/9 | 11.62 | 0.624 |
| 8:30 AM 12/9 | 11.62 | 0.624 |
| 8:15 AM 12/9 | 11.61 | 0.616 |
| 8:00 AM 12/9 | 11.6 | 0.608 |
| 7:45 AM 12/9 | 11.59 | 0.6 |
| 7:30 AM 12/9 | 11.58 | 0.592 |
| 7:15 AM 12/9 | 11.57 | 0.584 |
| 7:00 AM 12/9 | 11.56 | 0.576 |
| 6:45 AM 12/9 | 11.55 | 0.569 |
| 6:30 AM 12/9 | 11.55 | 0.569 |
| 6:15 AM 12/9 | 11.55 | 0.569 |
| 6:00 AM 12/9 | 11.54 | 0.561 |
| 5:45 AM 12/9 | 11.53 | 0.554 |
| 5:30 AM 12/9 | 11.53 | 0.554 |
| 5:15 AM 12/9 | 11.51 | 0.539 |
| 5:00 AM 12/9 | 11.5 | 0.532 |
| 4:45 AM 12/9 | 11.49 | 0.525 |
| 4:30 AM 12/9 | 11.48 | 0.517 |
| 4:15 AM 12/9 | 11.48 | 0.517 |
| 4:00 AM 12/9 | 11.48 | 0.517 |
| 3:45 AM 12/9 | 11.46 | 0.503 |
| 3:30 AM 12/9 | 11.45 | 0.496 |
| 3:15 AM 12/9 | 11.44 | 0.49 |
| 3:00 AM 12/9 | 11.43 | 0.483 |
16' -
At this level the approaches to the Sterling Highway bridge over Cooper Creek (miles 50.5) could be in danager of major erosion. There will also be large amounts of water flowing over the road from the campground.
15' -
At this level flow through the campground will be producing considerable damage, there will also be substantial water over the Sterling Highway.
14' -
Once the river is over it's bank, the creek will flood a campground (Cooper Creek south), which contains about 15 sites. Water would also flow from the campground out onto mile 50.5 of the Sterling Highway.
| Date | Stage (ft) |
|---|---|
| Oct 23, 2002 | 12.45 |
| Oct 16, 2018 | 11.83 |
| Jun 18, 2018 | 11.78 |
| Oct 10, 2006 | 11.38 |
| Oct 2, 2010 | 11.38 |
| Sep 23, 2012 | 11.28 |
| Jun 23, 2001 | 11.19 |
| Dec 9, 2019 | 11.12 |
| Oct 3, 2020 | 11.08 |
| Oct 28, 2013 | 11.06 |
| Sep 18, 1999 | 11.04 |
| May 29, 2013 | 10.99 |
| Oct 3, 2004 | 10.98 |
| Nov 22, 2007 | 10.93 |
| Jun 7, 2000 | 10.91 |
| May 30, 2010 | 10.86 |
| Jun 20, 2016 | 10.7 |
| Oct 3, 2017 | 10.66 |
| Apr 19, 2015 | 10.54 |
| Nov 10, 2016 | 10.28 |
Data provided by the National Weather Service.