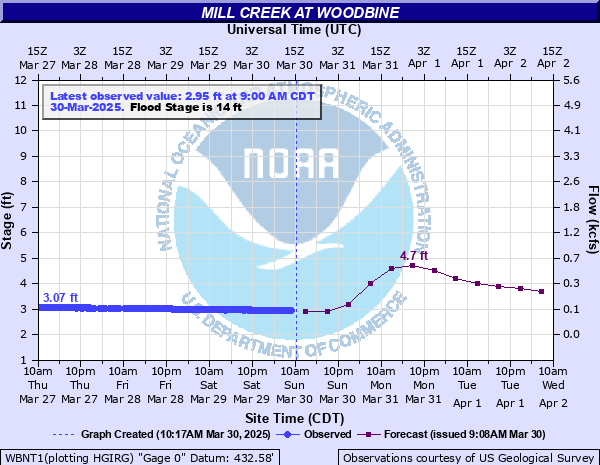
Mill Creek at Woodbine
Critical Stages
12' - Action
14' - Flood
17' - Moderate
21' - Major
Latest Observation
Updated: 11:00 AM CST 12/7/25
Status: No Flooding
Stage: 3.17 ft
Flow: 0.111 kcfs
Forecast
| Time | Stage (ft) | Flow (kcfs) |
|---|---|---|
| 6 PM 12/7 | 3.1 | 0.097 |
| 12 AM 12/8 | 3.1 | 0.097 |
| 6 AM 12/8 | 3.1 | 0.097 |
| 12 PM 12/8 | 3.1 | 0.097 |
| 6 PM 12/8 | 3 | 0.0793 |
| 12 AM 12/9 | 3 | 0.0793 |
| 6 AM 12/9 | 3 | 0.0793 |
| 12 PM 12/9 | 3 | 0.0793 |
| 6 PM 12/9 | 3 | 0.0793 |
| 12 AM 12/10 | 3 | 0.0793 |
| 6 AM 12/10 | 2.9 | 0.0641 |
| 12 PM 12/10 | 2.9 | 0.0641 |
| 6 PM 12/10 | 2.9 | 0.0641 |
| 12 AM 12/11 | 2.9 | 0.0641 |
| 6 AM 12/11 | 2.9 | 0.0641 |
| 12 PM 12/11 | 2.9 | 0.0641 |
| 6 PM 12/11 | 2.9 | 0.0641 |
| 12 AM 12/12 | 2.8 | 0.0509 |
| 6 AM 12/12 | 2.8 | 0.0509 |
| Time | Stage (ft) | Flow (kcfs) |
|---|---|---|
| 11:00 AM 12/7 | 3.17 | 0.111 |
| 10:45 AM 12/7 | 3.17 | 0.111 |
| 10:30 AM 12/7 | 3.17 | 0.111 |
| 10:15 AM 12/7 | 3.17 | 0.111 |
| 10:00 AM 12/7 | 3.17 | 0.111 |
| 9:45 AM 12/7 | 3.18 | 0.113 |
| 9:30 AM 12/7 | 3.17 | 0.111 |
| 9:15 AM 12/7 | 3.18 | 0.113 |
| 9:00 AM 12/7 | 3.18 | 0.113 |
| 8:45 AM 12/7 | 3.19 | 0.115 |
| 8:30 AM 12/7 | 3.18 | 0.113 |
| 8:15 AM 12/7 | 3.18 | 0.113 |
| 8:00 AM 12/7 | 3.18 | 0.113 |
| 7:45 AM 12/7 | 3.19 | 0.115 |
| 7:30 AM 12/7 | 3.19 | 0.115 |
| 7:15 AM 12/7 | 3.19 | 0.115 |
| 7:00 AM 12/7 | 3.19 | 0.115 |
| 6:45 AM 12/7 | 3.19 | 0.115 |
| 6:30 AM 12/7 | 3.19 | 0.115 |
| 6:15 AM 12/7 | 3.19 | 0.115 |
| 6:00 AM 12/7 | 3.2 | 0.117 |
| 5:45 AM 12/7 | 3.2 | 0.117 |
| 5:30 AM 12/7 | 3.2 | 0.117 |
| 5:15 AM 12/7 | 3.2 | 0.117 |
| 5:00 AM 12/7 | 3.2 | 0.117 |
| 4:45 AM 12/7 | 3.2 | 0.117 |
| 4:30 AM 12/7 | 3.2 | 0.117 |
| 4:15 AM 12/7 | 3.2 | 0.117 |
| 4:00 AM 12/7 | 3.2 | 0.117 |
| 3:45 AM 12/7 | 3.2 | 0.117 |
23' -
Flooding of commercial, residential, and industrial properties and structures along Mill Creek from the Space Park industrial complex to the Cumberland River is occurring. Locations affected include Drummond Dr, Wimpole Dr, Currey Rd, Old Glenrose Ave, Massman Dr, Wilhagen Rd, Space Park Dr, Philfre Ct, Sanborn Drive, Lynnmeade Dr, Bismark Drive, and Acorn Drive.
21' -
Extensive flooding is occurring from the Space Park industrial complex to the Cumberland River, impacting commercial, residential, and industrial properties on Drummond Dr, Wimpole Dr, Currey Rd, Old Glenrose Ave, Massman Dr, Wilhagen Rd, Space Park Dr, Philfre Ct, Sanborn Drive, and Lynnmeade Drive. Water reaches the bottom of the Thompson Ln bridge, and begins to approach properties on Foothill Dr, Hollydale Drive, Bismark Dr, and Acorn Dr.
19' -
Flooding of commercial, industrial, and residential properties and structures continues along Mill Creek, especially those on Drummond Dr, Wimpole Dr, Currey Rd, Old Glenrose Ave, Massman Dr, Wilhagen Rd, Space Park Drive, Philfre Ct, Sanborn Dr, and Lynnmeade Dr.
17' -
Flooding of commercial, industrial, and residential properties along Mill Creek is occurring. Locations impacted include those on Drummond Dr, Wimpole Dr, Currey Rd, Old Glenrose Ave, Massman Dr, Wilhagen Rd, Space Park Dr, and Philfre Ct.
16' -
Businesses and other structures near the intersection of Old Glenrose Ave and Thompson Ln begin to flood, as well as industrial areas along Space Park Dr. Water begins to approach commercial and industrial properties along Massman Dr and Wilhagen Rd.
15' -
Flooding of residential properties along Drummond Dr and the mobile home park on Philfre Ct near Murfreesboro Pike begins. Flooding of property continues along Wimpole Drive, Currey Road, and at the intersection of Old Glenrose Ave and Thompson Ln.
14' -
Water begins to flood the yards of homes along Wimpole Dr and Currey Rd near Thompson Ln, and the low lying portions of businesses near the intersection of Old Glenrose Ave and Thompson Ln.
13' -
Water begins to flood portions of Old Glenrose Ave north of Thompson Ln, and low lying areas along the creek on Wimpole Dr. Water also begins to inundate low lying areas of properties on Drummond Dr.
12' -
Water begins to approach portions of Old Glenrose Ave north of Thompson Ln, and begins to inundate low lying areas of properties along the creek on Wimpole Dr.
| Date | Stage (ft) |
|---|---|
| May 1, 2010 | 21.77 |
| May 4, 1979 | 20.63 |
| Feb 14, 1989 | 16.88 |
| May 5, 2003 | 16.15 |
| Mar 12, 1975 | 15.76 |
| Jun 4, 1998 | 15.76 |
| May 7, 1984 | 15.7 |
| May 25, 2000 | 15.66 |
| Feb 5, 2004 | 15.51 |
| Oct 5, 1995 | 15.5 |
| May 19, 1983 | 15.32 |
| Mar 3, 1997 | 15.16 |
| Dec 3, 1991 | 14.99 |
| Jan 10, 1974 | 14.83 |
| Jan 23, 1999 | 14.55 |
| Oct 19, 2004 | 14.41 |
| Mar 28, 1980 | 14.27 |
| Oct 17, 1975 | 14.19 |
| Apr 28, 2013 | 14.02 |
| Jun 21, 1970 | 13.75 |
Data provided by the National Weather Service.