« Back to Mount Pleasant Rivers
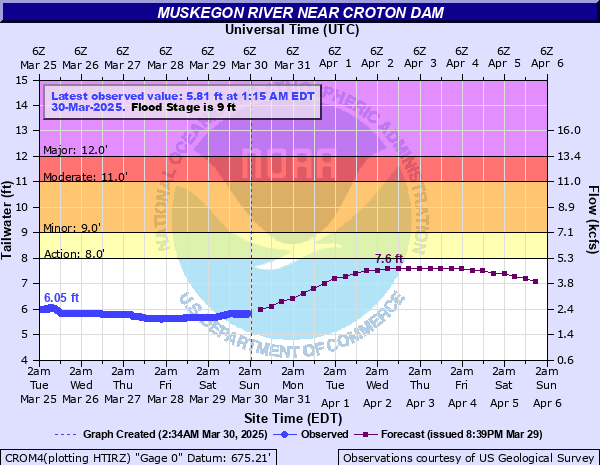
Muskegon River near Croton Dam
Critical Stages
8' - Action
9' - Flood
11' - Moderate
12' - Major
Latest Observation
Updated: 2:15 PM EST 12/10/25
Status: No Flooding
Stage: 4.87 ft
Flow: 1.14 kcfs
Forecast
Forecast not available for this location.
| Time | Stage (ft) | Flow (kcfs) |
|---|---|---|
| 2:15 PM 12/10 | 4.87 | 1.14 |
| 2:00 PM 12/10 | 4.88 | 1.14 |
| 1:45 PM 12/10 | 4.88 | 1.14 |
| 1:30 PM 12/10 | 4.89 | 1.15 |
| 1:15 PM 12/10 | 4.89 | 1.15 |
| 1:00 PM 12/10 | 4.89 | 1.15 |
| 12:45 PM 12/10 | 4.89 | 1.15 |
| 12:30 PM 12/10 | 4.89 | 1.15 |
| 12:15 PM 12/10 | 4.89 | 1.15 |
| 12:00 PM 12/10 | 4.89 | 1.15 |
| 11:45 AM 12/10 | 4.89 | 1.15 |
| 11:30 AM 12/10 | 4.89 | 1.15 |
| 11:15 AM 12/10 | 4.89 | 1.15 |
| 11:00 AM 12/10 | 4.89 | 1.15 |
| 10:45 AM 12/10 | 4.89 | 1.15 |
| 10:30 AM 12/10 | 4.89 | 1.15 |
| 10:15 AM 12/10 | 4.89 | 1.15 |
| 10:00 AM 12/10 | 4.89 | 1.15 |
| 9:45 AM 12/10 | 4.89 | 1.15 |
| 9:30 AM 12/10 | 4.89 | 1.15 |
| 9:15 AM 12/10 | 4.89 | 1.15 |
| 9:00 AM 12/10 | 4.89 | 1.15 |
| 8:45 AM 12/10 | 4.89 | 1.15 |
| 8:30 AM 12/10 | 4.89 | 1.15 |
| 8:15 AM 12/10 | 4.89 | 1.15 |
| 8:00 AM 12/10 | 4.89 | 1.15 |
| 7:45 AM 12/10 | 4.9 | 1.16 |
| 7:30 AM 12/10 | 4.89 | 1.15 |
| 7:15 AM 12/10 | 4.89 | 1.15 |
| 7:00 AM 12/10 | 4.89 | 1.15 |
13' -
Flood water begins surrounding properties on Russel Road and Salmon Run in Croton Township, Cottonwood Flats and Gould Subdivision in Brooks Township. Expect major flooding of Devils Hole.
12' -
Expect major flooding of 16 properties in Devils Hole.
11' -
Expect minor flooding in Devils Hole in Brooks Township.
10.5' -
Flood water begins surrounding cottages in Devils Hole and Main Street in Brooks Township. Expect all public river access sites to be closed.
10' -
Expect all public river access sites to be closed.
9' -
Expect minor flooding in low lying areas along the river.
8' -
River is bankfull. River begins to exceed its banks and minor flooding begins in low lying areas along the river.
| Date | Stage (ft) |
|---|---|
| Sep 12, 1986 | 16.8 |
| Apr 15, 2014 | 12.89 |
| Feb 21, 2018 | 11.55 |
| Apr 19, 2013 | 11.11 |
| Apr 29, 2011 | 10.64 |
| May 24, 2004 | 10.45 |
| May 19, 2020 | 10.33 |
| Mar 15, 2019 | 10.08 |
| Jan 30, 2013 | 9.88 |
| May 10, 2004 | 9.52 |
| Mar 14, 2006 | 9.42 |
| Oct 2, 2019 | 9.21 |
| Apr 2, 1998 | 9.12 |
| Apr 4, 2005 | 9.1 |
| Oct 25, 2017 | 9.04 |
| Jun 23, 2017 | 8.96 |
| Dec 29, 2008 | 8.89 |
| Apr 10, 2015 | 8.79 |
| Jun 9, 2008 | 8.78 |
| Mar 10, 2002 | 8.67 |
Data provided by the National Weather Service.