« Back to Mount Pleasant Rivers
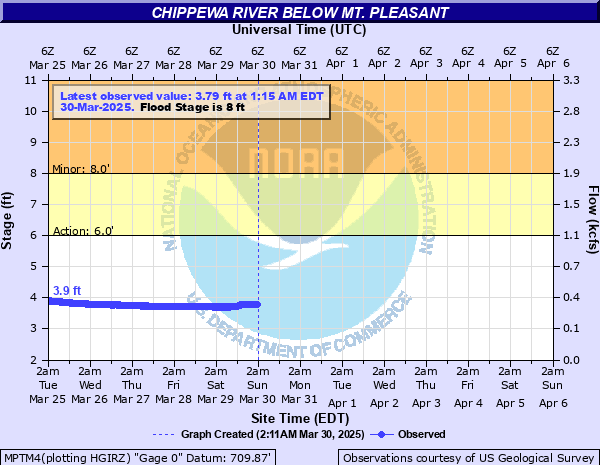
Chippewa River below Mt. Pleasant
Critical Stages
6' - Action
8' - Flood
11' - Moderate
13' - Major
Latest Observation
Updated: 2:15 PM EST 12/10/25
Status: No Flooding
Stage: 4.28 ft
Flow: 0.479 kcfs
Forecast
Forecast not available for this location.
| Time | Stage (ft) | Flow (kcfs) |
|---|---|---|
| 2:15 PM 12/10 | 4.28 | 0.479 |
| 2:00 PM 12/10 | 4.27 | 0.475 |
| 1:45 PM 12/10 | 4.27 | 0.475 |
| 1:30 PM 12/10 | 4.27 | 0.475 |
| 1:15 PM 12/10 | 4.27 | 0.475 |
| 1:00 PM 12/10 | 4.27 | 0.475 |
| 12:45 PM 12/10 | 4.27 | 0.475 |
| 12:30 PM 12/10 | 4.27 | 0.475 |
| 12:15 PM 12/10 | 4.28 | 0.479 |
| 12:00 PM 12/10 | 4.29 | 0.482 |
| 11:45 AM 12/10 | 4.3 | 0.486 |
| 11:30 AM 12/10 | 4.31 | 0.489 |
| 11:15 AM 12/10 | 4.32 | 0.493 |
| 11:00 AM 12/10 | 4.33 | 0.496 |
| 10:45 AM 12/10 | 4.34 | 0.5 |
| 10:30 AM 12/10 | 4.35 | 0.503 |
| 10:15 AM 12/10 | 4.35 | 0.503 |
| 10:00 AM 12/10 | 4.36 | 0.507 |
| 9:45 AM 12/10 | 4.37 | 0.51 |
| 9:30 AM 12/10 | 4.38 | 0.514 |
| 9:15 AM 12/10 | 4.39 | 0.517 |
| 9:00 AM 12/10 | 4.4 | 0.521 |
| 8:45 AM 12/10 | 4.4 | 0.521 |
| 8:30 AM 12/10 | 4.4 | 0.521 |
| 8:15 AM 12/10 | 4.41 | 0.524 |
| 8:00 AM 12/10 | 4.42 | 0.528 |
| 7:45 AM 12/10 | 4.42 | 0.528 |
| 7:30 AM 12/10 | 4.42 | 0.528 |
| 7:15 AM 12/10 | 4.42 | 0.528 |
| 7:00 AM 12/10 | 4.42 | 0.528 |
15.6' -
Expect widespread major flooding of residences located in Northern and Western Mt. Pleasant. Parks and golf courses adjacent to the river are under high water. South Leaton Road is underwater near the bridge that crosses the Chippewa River.
15' -
Expect widespread major flooding of residences located in Northern and Western Mt. Pleasant. Parks and golf courses adjacent to the river are under high water.
11' -
Expect moderate flooding of residences located in the north part of Mt. Pleasant.
10' -
Expect minor flooding of residences located in the north part of Mt. Pleasant, with many homes surrounded by high water.
8' -
Expect minor flooding of Island Park and Nelson Park in western Mt. Pleasant.
6' -
River is bankfull. Expect minor flooding of low lying areas adjacent to the river including portions of the Mount Pleasant Country Club Golf Course.
| Date | Stage (ft) |
|---|---|
| Sep 12, 1986 | 15.58 |
| Jun 23, 2017 | 14.77 |
| Mar 8, 1946 | 12.78 |
| Feb 6, 1938 | 12.3 |
| Mar 20, 1948 | 12.3 |
| Jan 26, 1950 | 11.42 |
| Sep 1, 1975 | 11.18 |
| May 19, 2020 | 11.16 |
| Mar 6, 1935 | 11.06 |
| Apr 12, 1965 | 10.95 |
| May 19, 1974 | 10.67 |
| Apr 19, 2013 | 10.46 |
| Feb 1, 1988 | 10.44 |
| Apr 16, 2014 | 10.43 |
| Mar 21, 1976 | 10.41 |
| Apr 3, 1959 | 10.4 |
| Feb 21, 1994 | 10.29 |
| Mar 14, 2006 | 10.28 |
| May 3, 1933 | 10.2 |
| Mar 31, 1960 | 10.15 |
Data provided by the National Weather Service.