« Back to Mount Pleasant Rivers
Maple River at Maple Rapids
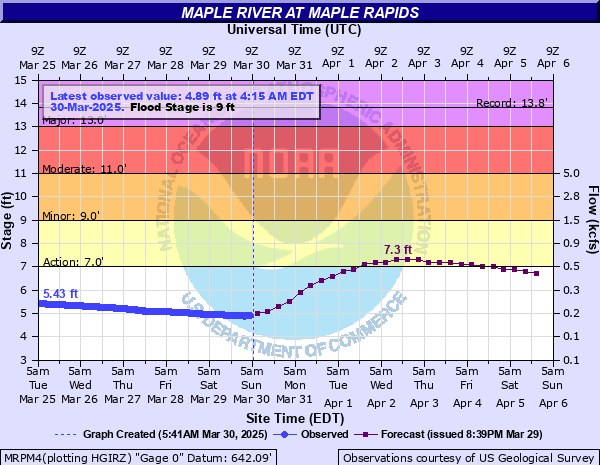
Critical Stages
7' - Action
9' - Flood
11' - Moderate
13' - Major
Latest Observation
Updated: 2:15 PM EST 12/10/25
Status: No Flooding
Stage: 2.92 ft
Flow: 0.0422 kcfs
Forecast
Forecast not available for this location.
| Time | Stage (ft) | Flow (kcfs) |
|---|---|---|
| 2:15 PM 12/10 | 2.92 | 0.0422 |
| 2:00 PM 12/10 | 2.92 | 0.0422 |
| 1:45 PM 12/10 | 2.92 | 0.0422 |
| 1:30 PM 12/10 | 2.92 | 0.0422 |
| 1:15 PM 12/10 | 2.92 | 0.0422 |
| 1:00 PM 12/10 | 2.92 | 0.0422 |
| 12:45 PM 12/10 | 2.92 | 0.0422 |
| 12:30 PM 12/10 | 2.92 | 0.0422 |
| 12:15 PM 12/10 | 2.92 | 0.0422 |
| 12:00 PM 12/10 | 2.92 | 0.0422 |
| 11:45 AM 12/10 | 2.92 | 0.0422 |
| 11:30 AM 12/10 | 2.92 | 0.0422 |
| 11:15 AM 12/10 | 2.92 | 0.0422 |
| 11:00 AM 12/10 | 2.92 | 0.0422 |
| 10:45 AM 12/10 | 2.92 | 0.0422 |
| 10:30 AM 12/10 | 2.92 | 0.0422 |
| 10:15 AM 12/10 | 2.91 | 0.0416 |
| 10:00 AM 12/10 | 2.91 | 0.0416 |
| 9:45 AM 12/10 | 2.91 | 0.0416 |
| 9:30 AM 12/10 | 2.91 | 0.0416 |
| 9:15 AM 12/10 | 2.91 | 0.0416 |
| 9:00 AM 12/10 | 2.91 | 0.0416 |
| 8:45 AM 12/10 | 2.91 | 0.0416 |
| 8:30 AM 12/10 | 2.91 | 0.0416 |
| 8:15 AM 12/10 | 2.91 | 0.0416 |
| 8:00 AM 12/10 | 2.91 | 0.0416 |
| 7:45 AM 12/10 | 2.91 | 0.0416 |
| 7:30 AM 12/10 | 2.91 | 0.0416 |
| 7:15 AM 12/10 | 2.9 | 0.041 |
| 7:00 AM 12/10 | 2.9 | 0.041 |
13' -
Expect major flooding of residences adjacent to the river and high water affects the Village of Maple Rapids.
12.33' -
Expect moderate flooding of basements of residences adjacent to the river. High water affects Maple Street at the Maple River Bridge and County Line Road as well as many side roads south and west of Maple Rapids.
12' -
Expect moderate flooding of residences, secondary roads, and farmlands adjacent to the river.
9' -
Expect minor flooding of County Line Road and a home along County Line Road.
7' -
River is bankfull. Expect minor flooding in low lying pastures, farmland, and wooded areas adjacent to the river.
| Date | Stage (ft) |
|---|---|
| Mar 1, 1904 | 13.8 |
| Sep 12, 1986 | 12.33 |
| Oct 2, 1986 | 11.27 |
| Mar 20, 1948 | 11.22 |
| Apr 18, 2013 | 11.02 |
| Jun 27, 2021 | 10.29 |
| Jul 8, 1994 | 10.27 |
| Mar 31, 1960 | 10.22 |
| Mar 5, 1976 | 10.17 |
| Feb 21, 2018 | 10.03 |
| Apr 6, 1947 | 9.97 |
| Feb 22, 1997 | 9.95 |
| May 19, 2020 | 9.94 |
| May 10, 1956 | 9.93 |
| Apr 6, 2023 | 9.92 |
| Mar 4, 1985 | 9.87 |
| Mar 17, 1982 | 9.86 |
| Oct 4, 2019 | 9.82 |
| May 24, 2004 | 9.8 |
| Mar 6, 2004 | 9.73 |
Data provided by the National Weather Service.