« Back to Mount Pleasant Rivers
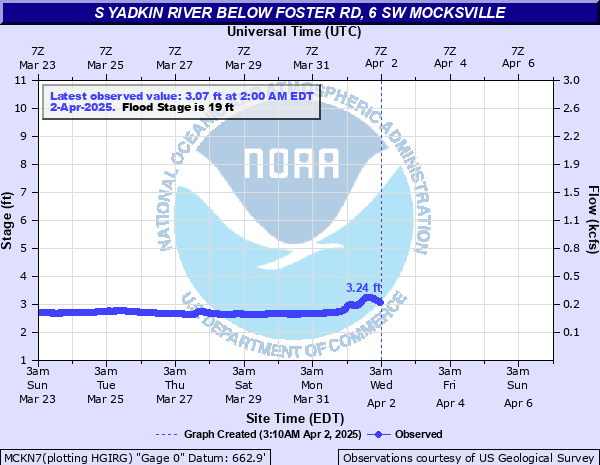
S Yadkin River below Foster Rd, 6 SW Mocksville
Critical Stages
18' - Action
19' - Flood
24' - Moderate
28' - Major
Latest Observation
Updated: 9:00 PM EST 12/8/25
Status: No Flooding
Stage: 2.58 ft
Flow: 0.226 kcfs
Forecast
Forecast not available for this location.
| Time | Stage (ft) | Flow (kcfs) |
|---|---|---|
| 9:00 PM 12/8 | 2.58 | 0.226 |
| 8:45 PM 12/8 | 2.58 | 0.226 |
| 8:30 PM 12/8 | 2.59 | 0.229 |
| 8:15 PM 12/8 | 2.58 | 0.226 |
| 8:00 PM 12/8 | 2.59 | 0.229 |
| 7:45 PM 12/8 | 2.58 | 0.226 |
| 7:30 PM 12/8 | 2.58 | 0.226 |
| 7:15 PM 12/8 | 2.59 | 0.229 |
| 7:00 PM 12/8 | 2.59 | 0.229 |
| 6:45 PM 12/8 | 2.59 | 0.229 |
| 6:30 PM 12/8 | 2.59 | 0.229 |
| 6:15 PM 12/8 | 2.59 | 0.229 |
| 6:00 PM 12/8 | 2.59 | 0.229 |
| 5:45 PM 12/8 | 2.59 | 0.229 |
| 5:30 PM 12/8 | 2.59 | 0.229 |
| 5:15 PM 12/8 | 2.59 | 0.229 |
| 5:00 PM 12/8 | 2.59 | 0.229 |
| 4:45 PM 12/8 | 2.59 | 0.229 |
| 4:30 PM 12/8 | 2.59 | 0.229 |
| 4:15 PM 12/8 | 2.59 | 0.229 |
| 4:00 PM 12/8 | 2.59 | 0.229 |
| 3:45 PM 12/8 | 2.59 | 0.229 |
| 3:30 PM 12/8 | 2.59 | 0.229 |
| 3:15 PM 12/8 | 2.6 | 0.231 |
| 3:00 PM 12/8 | 2.6 | 0.231 |
| 2:45 PM 12/8 | 2.6 | 0.231 |
| 2:30 PM 12/8 | 2.6 | 0.231 |
| 2:15 PM 12/8 | 2.6 | 0.231 |
| 2:00 PM 12/8 | 2.6 | 0.231 |
| 1:45 PM 12/8 | 2.6 | 0.231 |
28' -
Major Flood Stage.
24' -
Homes along the river near Cooleemee may be flooded.
21' -
Residential yards between the river and Potneck Road may begin to flood.
20' -
Minor Flooding is ongoing. Floodwater levels will be similar to floodwater levels that occurred on March 21, 2003.
19' -
Minor Flood Stage. Further downstream on the Yadkin River, Hollywood Drive near Gubb Ferry Road north of East Spencer will likely begin to flood due to backwater on Town Creek. RV parks in the upper reaches of High Rock Lake will likely be flooded.
18' -
Legacy Action Stage. Yards of homes downstream of gage near Cooleemee on South River Church Road may begin to flood. Areas off of Erwin Temple Church Road may be flooded.
10' -
Future Action Stage. The river will overflow the banks and farmland along the river will begin to flood.
| Date | Stage (ft) |
|---|---|
| Nov 13, 2020 | 25.56 |
| Oct 3, 1929 | 22.6 |
| Feb 7, 2020 | 21.57 |
| Mar 21, 2003 | 20.28 |
| Sep 28, 2024 | 19.79 |
| Mar 2, 1987 | 18.88 |
| Sep 23, 1979 | 18.59 |
| Oct 17, 1964 | 18.23 |
| Jan 26, 2010 | 18.04 |
| Mar 15, 1975 | 17.69 |
| Jun 22, 1972 | 17.02 |
| Jan 23, 1954 | 16.73 |
| Sep 19, 1945 | 16.02 |
| Aug 28, 1994 | 15.79 |
| Nov 8, 1977 | 15.78 |
| Aug 11, 1970 | 15.73 |
| Apr 23, 1992 | 15.67 |
| Oct 12, 2018 | 15.58 |
| May 27, 2009 | 15.34 |
| Apr 29, 1958 | 14.5 |
Data provided by the National Weather Service.